1. Introduction
Official statistics are an essential public asset. The UK Statistics Authority works to promote, monitor and safeguard the production and publication of official statistics. In accordance with the statutory requirements set by the Statistics and Registration Service Act 2007, we strive to ensure that official statistics are accessible, reliable and that they serve the public good.
The Authority’s casework function plays an important role in building public confidence in the production and use of official statistics. The Office for Statistics Regulation (OSR) is responsible for the Authority’s casework function, undertaking monitoring to identify issues and investigating issues raised with the Authority. This report provides a summary of casework for 2019/20. Given the high interest in the Authority’s work during the coronavirus pandemic the report also includes a short summary of casework for the first quarter of 2020/21 (1 April to 30 June 2020).
To find out more about our casework process and how to submit a concern visit the casework page on the OSR website.
What is casework?
One of the Authority’s key roles is to use our voice to stand up for statistics and to represent the public, monitoring and reporting publicly where we have concerns and highlighting good practice. Casework is the tool that best allows us to be responsive and investigate issues quickly as they arise.
There are two main routes to an issue becoming casework:
- we identify the issue (self-generated casework)
- someone brings the issue to our attention
The topics covered by casework can be varied, for example, around the misuse of statistics or aspects of the quality or presentation of a set of statistics. The Authority’s interventions policy explains how cases are brought to our attention and the factors we consider in determining if and how to intervene. The interventions policy is currently being reviewed, and we will be updating our website over the coming months.
The role of the Office for Statistics Regulation
The Office for Statistics Regulation (OSR) was established in 2016 as the regulatory arm of the UK Statistics Authority. OSR sets the Code of Practice for Statistics and is responsible for the Authority’s casework function, undertaking monitoring to identify issues and investigating issues raised with the Authority. OSR operates independently of statistical producers, including the Office for National Statistics (ONS). OSR’s remit covers all official statistics whether produced in ONS, government departments or other specified bodies.
Once an issue has been identified, OSR will consider the most effective response, working with the Authority Chair where relevant. Responses could be a private (by phone or letter), or through public statements and blogs highlighting issues. The decision on how to respond will be guided by the intervention policy and will focus on the desired outcome.
OSR has been developing automated monitoring to complement monitoring and horizon scanning undertaken by individuals within OSR and issues raised with us. This is a project under continuous development, but has already supported OSR in identifying issues, for example through monitoring Twitter and highlighting relevant issues. Issues identified through this route sometimes become self-generated casework which allows us to monitor issues so that they can then dealt with more effectively and quickly if subsequently brought to our attention by others.
Context
This report focuses on casework raised (externally or internally) between 1 April 2019 and 31 March 2020. During this period there was a strong focus on EU Exit and the General Election in December 2019. In March 2020, the coronavirus pandemic led to unprecedented changes in society and the economy which have been reflected in Casework during 2020. In the first quarter of 2020/21 there was a big increase in casework. As a result of this and the continued priority of COVID-19, a short summary of casework for the period 1 April 2020 to 30 June 2020 has also been included in this report. A full report for April 2020 to March 2021 will be published in summer 2021.
Notes
- Percentages have been rounded to the nearest whole percent.
- When calculating response times, cases that were closed on the same day they came in, have a 1-day response time, rather than 0.
- Internally generated cases are issues that have been noticed by internal staff. The OSR team actively monitor the use of statistics in public debate. During the run up to the 2019 General Election this involved reviewing manifestos, debates and speeches, as well as social media content.
- The categories in this report are provided to give an indication of the areas and issues covered by casework. There may be cases which could be classified as multiple categories; in these cases a decision has been made on which single category is most relevant. As part of a range of process improvements OSR is looking to develop the categories and make improvements to the management information associated with Casework.
- Casework complaints are broadly split into two categories – use/misuse of statistics, and compliance with the Code of Practice for Statistics. Use/misuse is the most common issue – where statistics have been used inappropriately or incorrectly in public debate (whether deliberately or not). Code compliance assesses whether official statistics have been produced and presented in a way that the Code of Practice would expect. OSR also considers whether official statistics meet the expectations of the code through its range of other regulatory work.
- The time taken to complete casework can have a large level of skew and so where possible both the median and the arithmetic mean have been calculated. In order to offset the effects of this skewness the median will, where possible, be used in discussion.
2. COVID-19: Casework Summary April to June 2020
The period from April to June 2020 was the busiest on record for casework. There were 110 items of casework opened during this period, including queries received and self-generated issues. Despite only covering the first quarter of 2020/21 this is higher than the total number of cases for any previous year (see Figure 1).
- Nearly 90% of cases (96 out of 110) were related to coronavirus. Many of these were associated with information on the number of COVID-19 cases or deaths, and some issues related to the impact of the pandemic e.g. Universal Credit figures.
- The mean time taken to close cases opened during this period was 11 days, with a median of 8. This compares with the 2019/20 mean time to close a case of just under 20 days, with a median of 13 days.
- 20% of cases were internally generated (i.e. were investigated as a result of the issue being identified from within the OSR team).
The most high-profile intervention between April and June 2020 was correspondence between Sir David Norgrove, Chair of the UK Statistics Authority and Matt Hancock MP, Secretary of State for Health and Social Care. Some of the improvements resulting from this intervention are highlighted in the letter concluding the rapid review of the Test and Trace System.
During the first half of 2020, OSR has made improvements to internal processes and had a greater focus on impact. For example, we brought together in a single response similar issues arising in a range of casework, such as our statements on Production and use of management information by government and other official bodies in May 2020 and Presenting estimates of R by government and allied bodies across the United Kingdom in June 2020.
At a time when producers of statistics are under increased pressure and there are greater volumes of data flowing around government it has been even more important to focus on the impact of interventions and the best way to achieve an outcome. This will sometimes be through informal engagement with relevant organisations and individuals and sometimes requires more formal statements or correspondence.
3. 2019/20: Casework Summary April 2019 to March 2020
Key Findings
In the period 1 April 2019 to 31 March 2020 the Authority considered 109 pieces of casework. This was an increase on the previous year (104).
- Just over a quarter of cases for the year (29 out of 109) were opened during the run-up to the 2019 General Election (from the announcement on 28 October to 11 December inclusive), with November 2019 being the month with the highest number of cases opened (18).
- Just over half (52%) of cases were about use/misuse of statistics; this is in line with 2018/19.
- The increase in casework was driven by internally generated cases. Nearly 40% of cases were internally generated in 2019/20, compared with 19% in 2018/19.
- Children, Education and Skills made up the highest proportion of cases (28% of all cases) with many of these relating to claims about school funding figures.
- The average (median) time taken from opening to closing a case was 13 days (mean 20 days), compared to 2018/19 when the average was 24 days (median and 30 days, mean).
3.1 How many cases did we receive?
A total of 946 cases have been considered by the Authority between 1 April 2008 and 31 March 2020, see Figure 1. In 2019/20 the Authority considered 109 pieces of casework. This is 5 more than the previous year (an increase of approximately 5%) and higher than any preceding year. However, this does not relate to an increase in submissions from the public as the number of cases generated externally decreased from 84 to 66. This is highlighted in Figure 4 where a large increase in self-generated casework can be seen. Figure 1 shows the number of cases considered each year from 2008/09 to 2019/20.
Figure 1: Cases considered 2008/09 to 2019/20
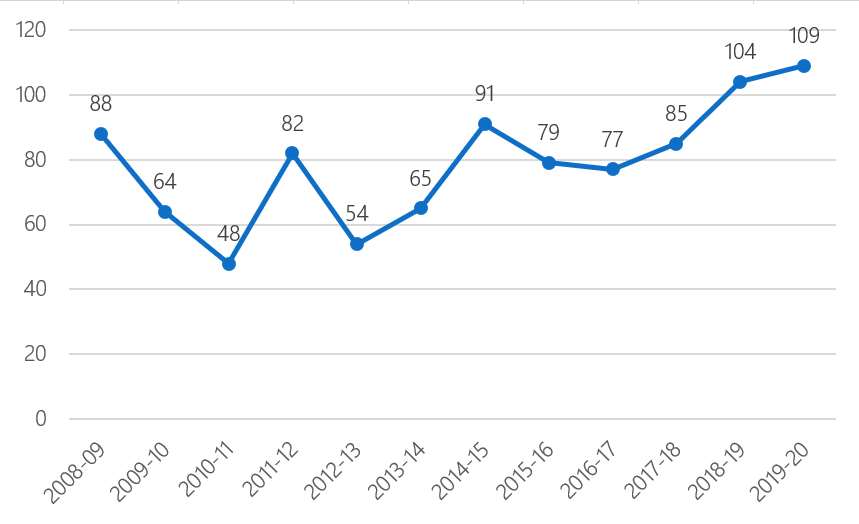
Source: Office for Statistics Regulation
Figure 2: Cases logged per month April 2019 – March 2020
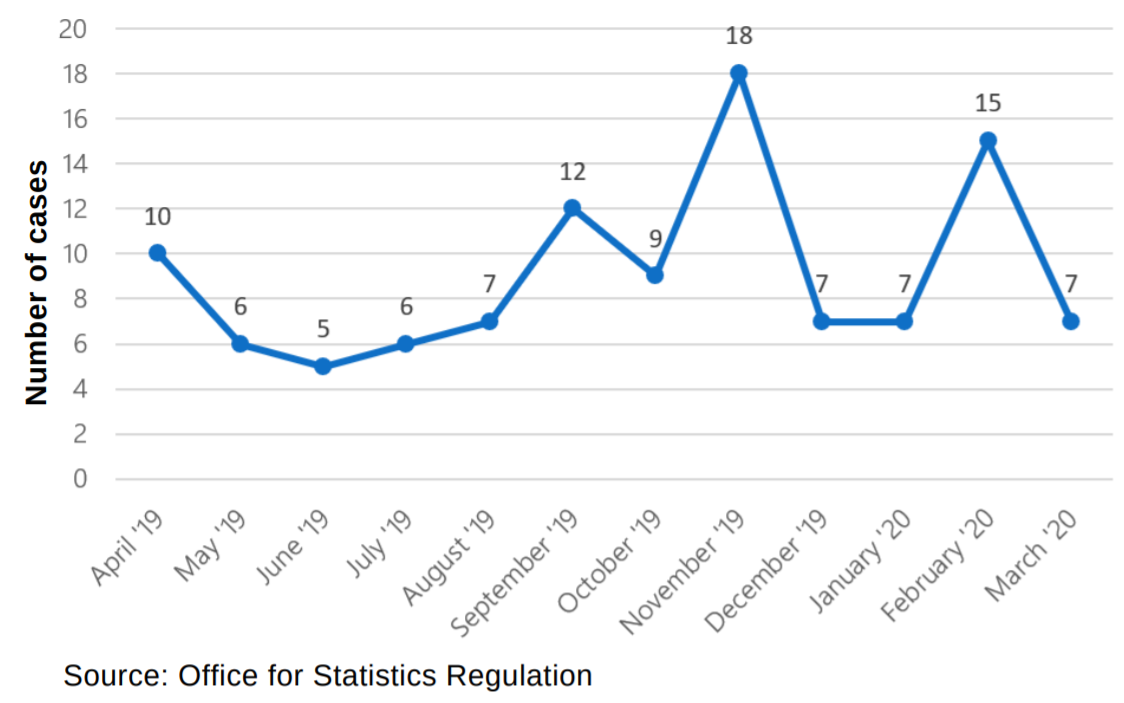
The month with the most cases was November (18). This was driven largely by the issues arising during the pre-election period, in advance of the December 2019 General Election. OSR was more proactive in monitoring potential issues than it had been in previous elections. 11 of the 18 cases considered in November were internally generated, however many related to areas which the Authority had previously publicly commented on.
The summer months (May, June, July, August) saw the lowest volume of casework (22% or an average of six per month). This is similar to the previous year when there was an average of five cases per month over these four months. While the number of cases for March 2020 was relatively low (7 cases), the end of the month contained the first few cases on coronavirus. There was no obvious driver for the relatively high number of cases in February 2020 (15), which covered a range of issues and topics.
3.2 What was the nature of the issues?
Casework complaints are broadly split into two categories – use/misuse of statistics, and compliance with the Code of Practice for Statistics.
Use/misuse is the most common issue – where there is a concern about statistics having been used inappropriately or incorrectly in public debate (whether deliberately or not).
Code compliance assesses whether official statistics have been produced and presented in line with the Code of Practice for Statistics.
This section summarises the types of issues raised through casework, comparing 2019/20 to the previous year. The types of issues considered remained broadly similar to the previous year with use/misuse of statistics being the most prevalent (52% in 2019/20 and 2018/19).
Figure 3: Percentage of cases considered by category of concern
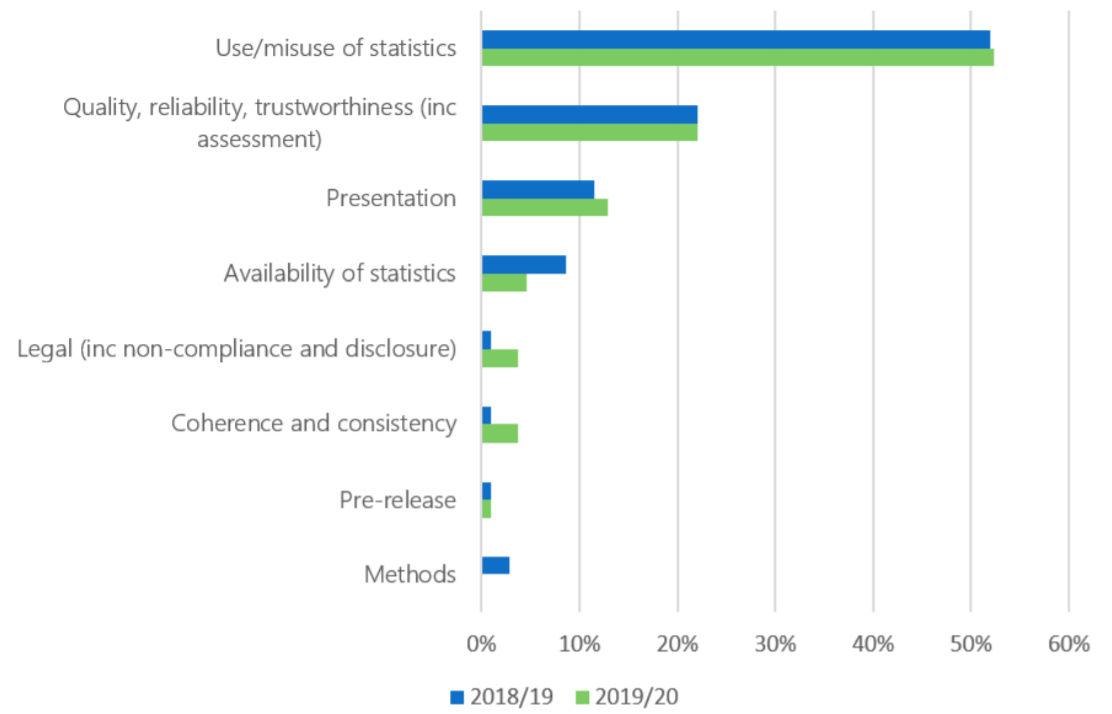
Source: Office for Statistics Regulation
More than half of cases (52% or 57 cases) relate to the use/misuse of statistics. These are often instances where statistics have been used in a way which someone considers potentially misleading, most commonly the use is by a public figure or in a press release from a public body. These types of issues can be picked up through individuals writing to the Authority, or through OSR’s media and social media monitoring. In 2019/20, of the 57 cases in this category, 25 cases (44%) were internally generated and 18 (32%) came from members of the public. Other sources included members of parliament, the media, statistical producers and academics.
Of the other categories, the most common is quality, reliability and trustworthiness. Of the 24 cases in this category in 2019/20, 10 (42%) were internally generated.
3.3 How long did it take to close cases?
This section of the report provides information on the time taken to close a case. This is the time taken between opening a case to closing a case. During 2019/20 OSR has worked to improve processes so that more cases are turned around more quickly. However, it is important to note that this is never at the expense of making an informed judgement. Therefore, while closure times and response times are important, it is not the only metric driving casework.
The report sets out the average time to close a case, giving the median and mean. The median is considered the headline measure as it best reflects the typical experience. In 2019/20 the median time taken to close a case was 13 days. This means that 50% of cases were closed in 13 days or less, compared with 24 days in 2018/19. The mean time taken to close a case in 2019/20 was 20 days. This number is higher than the median as it is more strongly influenced by a relatively small number of longer cases. The mean time taken to close a case in 2018/19 was 29 days.
The time taken to close a case covers internally and externally generated casework. The date of opening a case is the date a concern is received from an external source or the date an issue is identified. The date a case is closed is the point at which the issue has been considered and any necessary action taken. For externally generated casework this will usually include a response to the person or organisation that raised the concern. Some longer-term follow up actions, as well as the impact of the casework, will be tracked separately.
OSR seeks to respond to all those who email or write whether or not it agrees with the concern raised. Casework can also result in correspondence with the individual or organisation a concern relates to. Some of the correspondence will be published and some will be private.
Internally generated cases may not lead to any formal correspondence. For example, once a case has been considered no further action may be deemed necessary, or it could be resolved through informal engagement with stakeholders and departments.
The averages above mask a lot of variation in response times. Table 1 shows that in 2019/20:
- 45% of cases were closed in ten days or less (23% in 2018/19)
- 79% of cases were closed within 30 days (64% in 2018/19)
- there was only one case that was closed more than 100 days after it was opened, compared with four such cases in 18/19 (cases that take this long tend to be complex cases)
Table 1: Days from opening to closing a case 2019/20
| Casework Closure Time (Days) | Totals | Cumulative Totals | Percentages | Cumulative Percentages |
|---|---|---|---|---|
| 0-10 | 49 | 49 | 45% | 45% |
| 11-20 | 26 | 75 | 24% | 69% |
| 21-30 | 11 | 86 | 10% | 79% |
| 31-40 | 9 | 95 | 8% | 87% |
| 41-50 | 4 | 99 | 4% | 91% |
| 51-100 | 9 | 108 | 8% | 99% |
| 101+ | 1 | 109 | 1% | 100% |
Table 2: Average days to close a case by issue type
| Issue type | Count of cases | Median days to close a case | Mean days to close a case |
|---|---|---|---|
| Legal (inc non-compliance and disclosure) | 4 | 9 | 42 |
| Availability of statistics | 5 | 35 | 40 |
| Presentation | 14 | 20 | 23 |
| Quality, reliability, trustworthiness (inc assessment ) | 24 | 11 | 21 |
| Coherence and consistency | 4 | 18 | 19 |
| Use/misuse of statistics | 57 | 8 | 15 |
| Pre-release | 1 | 6 | 6 |
There are a range of factors which will influence the time taken to respond, for example the profile of the issue, the number of organisations which need to be engaged and the type of issue being considered. Table 2 shows the average days taken to close a case by type of issue (median and mean). Cases classified as availability of statistics typically took the longest to close at 35 days (median). However, if the mean is considered then legal cases have the biggest average, 42 days. This reflects the skew that can be present in closure and response times and in this case is the effect of one very long-running case (146 days). Use/misuse of statistics had a median response time of 8 days.
OSR aims to send an acknowledgement of any correspondence within 1 working day. For longer running cases updates will be provided as the work progresses.
Unfortunately, due to the process used to archive older casework data the time to reply is not available and so median values for years prior to 2016 are not available. Additionally, prior to 2018 no date for closing a case was recorded in cases where a reply was not sent out. These combined issues mean that limited data is available for examining changes across time.
Table 3: Average days to reply or close a case by year
| Year | Median time to reply | Median time to close case |
|---|---|---|
| 2016-17 | 23 | n/a |
| 2017-18 | 21 | n/a |
| 2018-19 | 25 | 20 |
| 2019-20 | 13 | 13 |
3.4 Who raised the issues?
This section summarises how casework was initiated including which groups raised casework. In addition to the seven categories considered last year, a further category of Statistical Producers has been included for 2019/20.
Of the 109 cases considered in 2019/20, internally generated casework made up 39% of all cases (43 cases). This is nearly double the proportion of cases which were internally generated the previous year (19%). The second highest source of case work (27%) was from members of the public. This is a decrease of 7 percentage points from the previous year, when it was the highest source of cases. There were 29 cases raised by members of the public in 2019/20 compared with 35 in 2018/19.
Figure 4: Casework by source
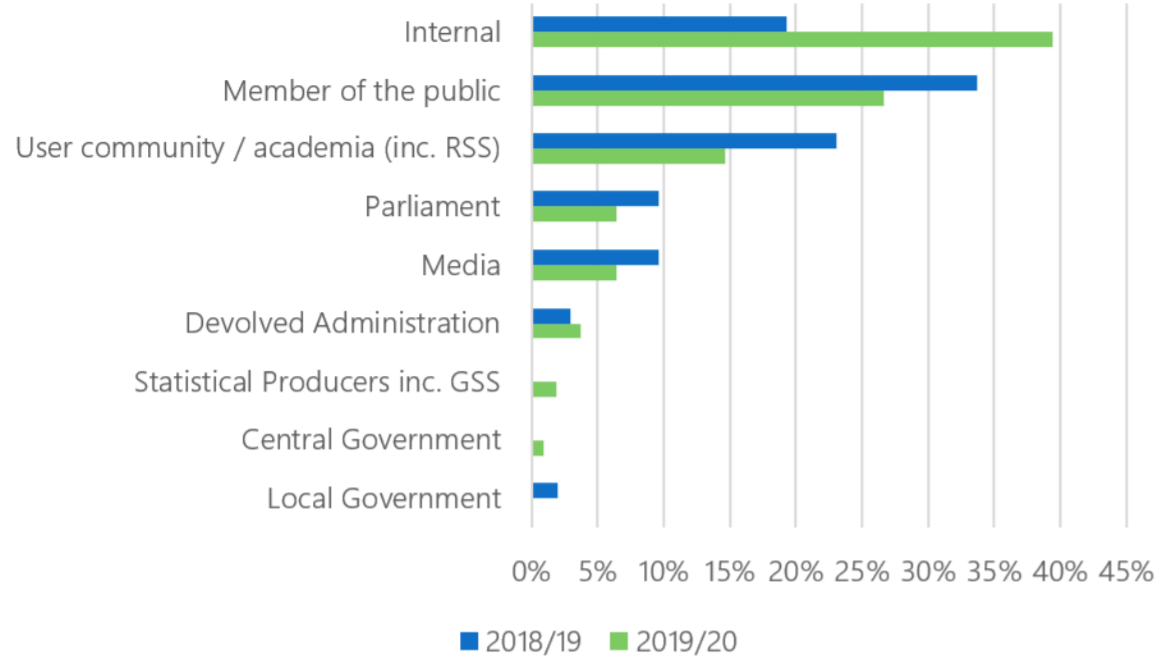
Source: Office for Statistics Regulation
3.4.1 Internally generated casework
Of the internally generated cases, 35% led to some form of correspondence and the remaining 65% were investigated and noted with no further immediate action. In some cases, while there was no further action, it may have led to informal discussion or ongoing monitoring.
3.4.2 Government and Parliaments
The Authority received 12 cases from members of Parliaments within the UK and Devolved administrations, or from officials in government. This includes cases raised by current members of UK, Scottish and Welsh Parliaments. In all but one case the Authority response was published. In the one exception, the issue was transferred to another department.
Children, Education and Skills account for 42% of the cases raised by these groups. The cases cover a range of issues including school funding and higher education statistics.
Casework discussed in parliament
During the period from 1 April 2019 and 31 March 2020 Authority interventions around the use and misuse of statistics have been mentioned in parliament nine times. Two of these mentions were in the Scottish Parliament and the remaining seven in Westminster. Four of the nine references related to casework carried out in previous years.
The appendix provides further details of references to Authority interventions in Parliaments within the UK.
3.5 What were the cases about?
Figure 5 shows the general themes of casework from 2019/20. These themes broadly correlate to the OSR domains.
Children, Education and Skills was the theme with the highest number of cases in 2019/20, comprising 28% (30) of the cases. The next highest was Health and Social Care with 17% of cases (18 cases). This was 8 percentage points lower than 2018/19 when Health and Social Care had been the most prevalent theme.
Figure 5: Casework by theme
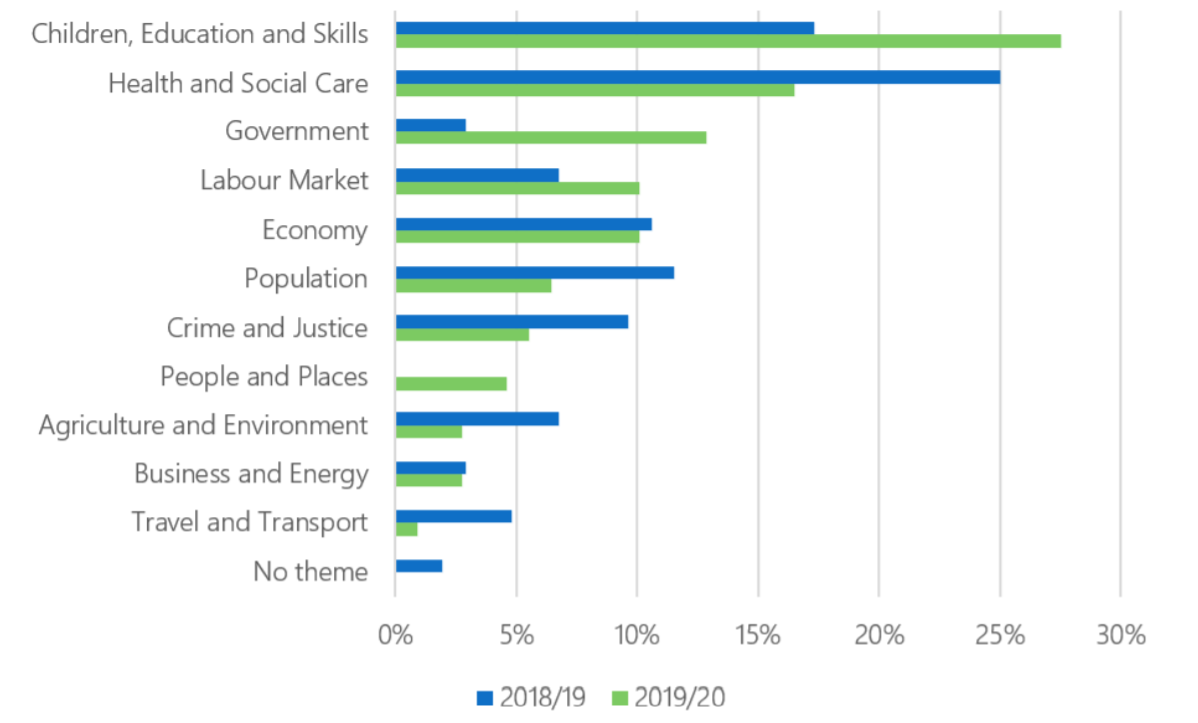
Source: Office for Statistics Regulation
Children, Education and Skills – In more depth
Of the 30 cases related to Children Education and Skills, two thirds related to statistics produced by the Department for Education.
The sources for Children, Education and Skills cases were almost evenly split between being generated internally by OSR (27%), raised by members of the public (23%) and raised by the user community (23%). The majority of issues raised related to use/misuse of statistics (63%). Casework in this theme covered a range of topics, but one area which featured repeatedly was school funding statistics.
In May 2019, OSR wrote a letter to the Department for Education, recommending it publish a set of official statistics on school funding that comply with the Code of Practice for Statistics.
In their party manifestos, both the Labour Party and Conservative Party made claims about schools funding.
- Labour manifesto: “Schools have faced years of budget cuts, leaving headteachers forced to beg parents for money for basic equipment. Despite promising to reverse their own cuts, the Tories latest funding announcement leaves 83 per cent of schools still facing cuts next year”
- Conservative Manifesto: “In his first months in office, Boris Johnson announced an extra £14 billion in funding for schools. That translates to £150 million a week, and will include at least £5,000 a year for each secondary school pupil and at least £4,000 for each primary school pupil. This also includes £780 million in new funding to support children with Special Educational Needs next year alone.”
These claims were picked up by OSR as they were repeats of claims the Authority had already commented on. The Authority published a statement highlighting its concerns with the claims and welcoming the Department for Education’s commitment to publishing official statistics on schools funding. The new statistics were first published in January 2020. OSR wrote to the Department for Education welcoming the new statistics.
For Children, Education and Skills related cases, the median time taken to close a case was 24 days (mean 29 days). Within this, 23% of cases were closed in less than 10 days and 63% of cases were closed in less than a month.
2019 General Election
On 28 October 2019, Parliament agreed to hold a snap general election in the UK. The pre-election period started on 6 November, with restrictions in place until polling day on 12 December. The analysis in this section looks at casework submitted or generated between 28 October and 11 December (inclusive), covering the date that the election was confirmed up to the day prior to the election taking place. Further information about our work during the pre-election period can be found in a blog on our website.
On 5 November 2019, Sir David Norgrove, Chair of the Authority, wrote to the leaders of all UK political parties reminding them of their duty to use statistics accurately and fairly in the forthcoming election campaign. The OSR team were more proactive in monitoring during the pre-election period than in previous elections. For example, reviewing manifestos and conducting ‘horizon scanning’ to support good use of statistics in public debate. The focus of this monitoring was on issues which the Authority had previously commented on.
Between 28 October and 11 December 2019 OSR considered 29 pieces of casework. This represented just over a quarter of the year’s casework in less than two months. Many of the cases considered during this period related to statistical claims made by politicians or political parties and nearly three quarters (72% or 21 cases) related to the ‘use/misuse of statistics.’ Around half of the cases were internally generated (52%).
Figure 6: Source of casework during election
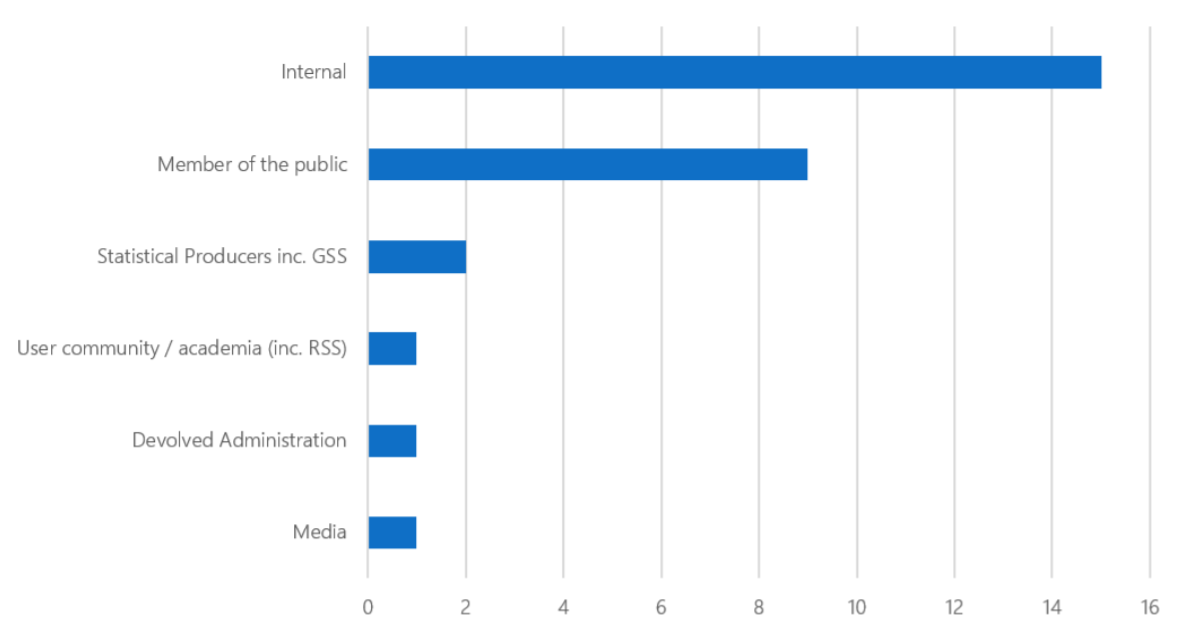
Source: Office for Statistics Regulation
Casework during the election covered a wide range of topics, with the highest proportion in the Health and Social Care category.
Figure 7: Election casework by theme
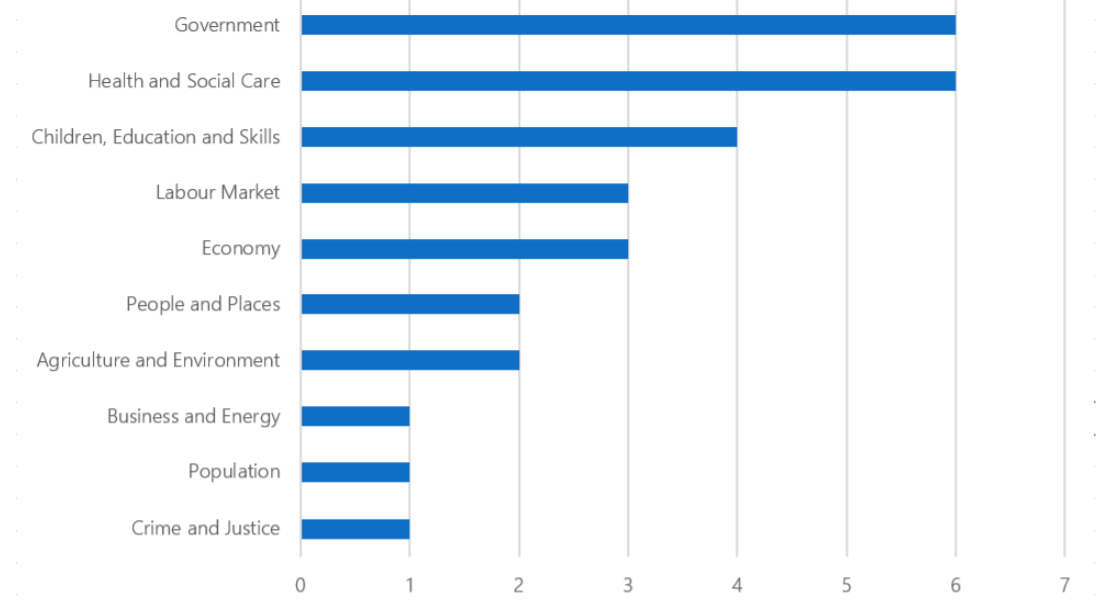
Source: Office for Statistics Regulation
Annex 1 – Parliamentary discussion of casework
23 April 2019 – HCLG Select Committee
During an oral evidence session on 23 April 2019 by the Housing, Communities and Local Government Committee as part of the Committee’s inquiry into the ‘Homelessness Reduction Act – One Year On’, the Authority’s interventions on homelessness statistics were mentioned:
“The Office for National Statistics said that the methods for doing the calculations weren’t fit for purpose, whether on one end it be on the rough sleeping the other end simply, people sleeping on friend’s sofas. There were not real, proper assessments.” – Clive Betts MP
“What they are saying at this stage is…and we entirely accept this and will comply with everything they require. Which is, that they want to make sure that the figure we are putting out which is the statistical information we have of a 19% for rough sleeping in the rough sleeping initiative areas.” – Jeremy Swain, Deputy Director of the Homelessness and Rough Sleeping Division at MHCLG
25 April 2019 – House of Commons
The October 2018 letter from the Authority to the former Secretary of State for Education, the Rt Hon Damian Hinds MP, was mentioned by Thangam Debbonaire MP during a debate on school funding on 25 April 2019:
“The Minister may wish to disagree with my arithmetic, or that of headteachers in Bristol, but I wonder whether he will accept that the chair of the UK Statistics Authority and the Institute for Fiscal Studies can do their numbers. Sir David Norgrove, chair of the UK Statistics Authority, said last October in a letter to the Secretary of State, in response to a blog by the Department for Education about education funding, that “figures were presented in such a way as to misrepresent changes in school funding…school spending figures were exaggerated by using a truncated axis, and by not adjusting for per pupil spend.” Those are not my words; they are the words of the chair of the UK Statistics Authority. He also noted that the Department “included a wide range of education expenditure unrelated to publicly funded schools”.”
1 July 2019 – House of Lords
During an oral question on the accuracy of statistics used by ministers in the House of Lords on 1 July 2019, Lord Watson of Invergowrie referenced the series of interventions made regarding the Department for Education’s use of school funding statistics:
“The UK Statistics Authority’s latest rebuke of the Department for Education over misleading statistics to support claims of generous funding for schools is the fifth since the Secretary of State for Education took up his post in January 2018.”
4 July 2019 – House of Lords
During a debate in the House of Lords on 4 July 2019 on protecting the NHS in future trade deals in post-Brexit Britain, the Authority’s intervention into the Vote Leave campaign’s use of statistics was mentioned by Lord Brooke of Alverthorpe:
“Noble Lords will not need reminding of Vote Leave’s claim that the UK would send to the NHS the £350 million being paid weekly to the EU. This was a harmful and shameful stunt emblazoned on the side of a red double-decker bus—another great British emblem—which the head of the UK Statistics Authority called: ‘a clear misuse of official statistics’ in a letter to Boris Johnson.”
1 October 2019 – House of Commons
During an urgent parliamentary question regarding the Government response to homeless deaths on 1 October 2019, Melanie Onn MP mentioned the Authority’s intervention earlier that year recommending that the Government improve the quality of homelessness figures:
“The speaker is here to convince us of the Government’s seriousness in taking forward this issue. Back in March the Government was urged by the UK Statistics Authority to improve its quality of homelessness figures because if the Government doesn’t know exactly how many people are homeless, how can it possibly expect to deal with the issue? What action has the Government taken on this advice?”
5 February 2020 – Scottish Parliament
During a Scottish Parliament debate on tax increases on 5 February 2020, John Mason MSP referenced the UK Statistics Authority’s response to the Scottish Government in August 2019 on the subject of income tax reconciliations:
“It is worth noting that the UK Treasury’s interpretation of the 2017-18 reconciliation is described as “somewhat disingenuous” by the Fraser of Allander institute, and I understand that the UK Statistics Authority upheld a complaint from Derek Mackay that the UK Government’s interpretation of the reconciliation was “incorrect”.”
25 February 2020 -House of Commons
The letter from Mr Healey to the Authority was mentioned by Sarah Jones MP on 25 February 2020 during an oral ministerial statement on rough sleeping in the Commons:
“Today’s figures come with a big health warning: everyone, from the Secretary of State to homelessness charities, knows that these statistics are an unreliable undercount of the true scale of the problem. The figures have been refused national statistics status—a mark of “trustworthiness, quality and public value”. Yesterday, Labour’s shadow Housing Secretary, my right hon. Friend the Member for Wentworth and Dearne (John Healey), wrote to the UK Statistics Authority to ask it to investigate their accuracy. That follows new data obtained by the BBC under the Freedom of Information Act, showing that Ministers have been dramatically under-reporting the scale of rough sleeping.”
27 February 2020 – House of Lords
During a Lords debate on rough sleeping on 27 February 2020, Lord Kennedy of Southwark referenced this intervention:
“The Government have no basis to parade their own figures as anything resembling an accurate picture. In 2019, the Office for Statistics Regulation said that it expected the Government to plan for better statistics on rough sleeping. The recent defence that these statistics are only a good estimate brings into question why they were ever published.”
12 March 2020 – Scottish Parliament
During First Minister’s Question Time in the Scottish Parliament on 12 March 2020, Lewis Macdonald MSP referred to a quote from Sir David Norgrove regarding Transport Scotland’s following of the code of practice:
“Sir David Norgrove, the chair of the UK Statistics Authority has today expressed ’concern’ about Transport Scotland’s ‘selective use of unpublished data’ in a news release on the Aberdeen western peripheral route last month. Does the first minister agree with Sir David that Transport Scotland must act in line with the code of practice for statistics, which applies to all producers of official statistics, and will she urge Transport Scotland to publish all the data in question without further delay?”
Related links:
Annual Review of UK Statistics Authority Casework, 2018 to 2019
Annual Review of UK Statistics Authority Casework, 2017 to 2018