Written by Owen Abbott and Viktor Racinskij, Office for National Statistics
Summary
The paper firstly outlines some options for producing national population size estimates for use in the 2021 Census national quality assurance from administrative data, in the absence of a fully operational population coverage survey. It concludes that using the Census Coverage Survey (CCS) is a viable option.
The panel are asked whether they agree with the conclusion in part 1.
The paper then proposes a methodology for mitigating against a lack of clerical resource to undertake a full, high quality, linkage between the administrative data and the CCS, within the timeframe for producing the estimates required. It explores the likely reduction in precision that results. It concludes that the resulting estimates are useful but likely to not be of sufficient quality to provide a target sex ratio.
The Panel are asked whether ONS should continue to explore the methodology presented in part 2.
Disclaimer: The second part of the paper is fairly late breaking research, it is presented to the panel to obtain some early feedback on the thinking and value of continuing to develop such an approach.
In order to provide confidence in the national level census estimates, or as part of the evidence to assess plausibility and suggest any bias adjustments, there is a desire to obtain an approximately unbiased estimate of the usually resident population as at census day which uses administrative data. Our research to date has shown that administrative data alone does not provide an approximately unbiased estimate even at national level (Abbott et al, 2020). This is due to over-coverage (in this case records that relate to people who are no longer in the population due to emigration or death and some duplication) which we are not able to reduce sufficiently through linkage and business rules applied to administrative sources alone.
The census quality criteria require the bias to be less than 0.5 per cent for age-sex groups at national level. In addition, we expect the census estimates to have confidence intervals around these national estimates of around 0.2 per cent for the total and between 0.2 per cent and 0.75 per cent for age-sex groups. For an age-sex population size of 2 million with a CI of plus or minus 0.3 per cent, this implies that our bias tolerance is 10,000 persons and our confidence interval will be around plus or minus 6,000 persons.
This paper has two parts. The first outlines the current position with regards to the strategy for population estimates using administrative data research and the availability of survey data for estimating coverage. The conclusion is that in the absence of a specifically designed survey, the CCS is a potential option for providing coverage measurement, albeit with some assumptions and conditions. However, due to the timing of the CCS and the requirement for this to feed into the census national quality assurance, full linkage to the required accuracy of the CCS to administrative data is not possible. The second part explores a methodology for producing population estimates using the CCS, under this situation of reduced clerical matching capacity. The quality of resulting estimates are explored.
Part 1 – Options for producing coverage adjusted estimates without IPACS
Our strategy for minimising bias in a population size estimate which uses administrative data is to use a survey to measure and correct for coverage errors, as described in Abbott et al (2020). The methodology for doing this is likely to be based on dual-system estimation techniques (there are various flavours which could be used). In broad terms, achieving an unbiased estimate requires:
- removing as much as possible of the over-coverage from the linked (or single source) administrative data used as one of the sources in the DSE, and then designing a survey to measure the resulting coverage (although noting that there is not a unique solution to this and many varieties may be possible)
- Linking that survey to the administrative data
- Using appropriate dual-system estimation to produce population estimates
- (possibly) developing a procedure to estimate and adjust for any residual biases (such as over-coverage, linkage error etc.)
There are challenges for each, but here we will focus on the survey aspect, where our strategy for using a specifically designed survey will not be possible.
Our initial survey strategy was to design a survey (IPACS) which would achieve, or get close to, the quality criteria required, by exploring sample size options for obtaining a national confidence interval of plus or minus 1 per cent. The Population Coverage Survey part of the IPACS design also future proofed the population statistics system, in that it could also be used to produce population estimates in non-census years, albeit at a larger scale where confidence interval widths are acceptable. The survey would be ongoing, with a rolling reference date. This complicates the estimation method when compared to a large one-off survey with a single reference date, as (for example) a rolling set of estimates would have to be produced, and a time series model applied to them. The census day estimate would then be provided via this time series model, with all the caveats around using a model. Depending on the type of time series model used (which would require some research), this meant that to obtain a census day estimate, sufficient sample would be required for at least a year before and for a few months after census day in order for the time series to be stable and the confidence intervals to be close to what is required.
Initial estimates suggested we would need an issued sample size of between 4000 and 5000 addresses per month starting from mid-2020 (assuming a 50 per cent response rate), to achieve the 1 per cent CI nationally. However, this has been shown not to be feasible in terms of practical implementation within the timeframe, and so an alternative must be explored.
For information about the size required in the longer term, additional exploration, albeit with some assumptions and caveats, showed the sample required to achieve a 0.25 per cent CI nationally required about 700,000 issued sample addresses (which is about 60,000 per month).
The criteria for being able to produce an estimate based on administrative data that could be used to QA the Census based population estimate are:
- Approximately unbiased estimates (within plus or minus 0.5 per cent as per census)
- Acceptable confidence intervals (similar to census, so that any census bias can be reliably detected)
- Independence – the estimate should be independent of the census estimate (i.e. Census + CCS), and the sources (admin and survey) should be independent for unbiased DSE
- The survey we use should be able to be delivered in the field
- Estimation methodology should be as simple as possible – to reduce development time and ensure user confidence (e.g. Time series models for population statistics have never been used in ONS before, so are not well understood)
- Survey response rates should be high – the higher they are, the less risk of bias in the estimates
- Linkage with high accuracy will be required – this is again required to minimise bias in DSE
- Timing – the estimate will need to be available for the Census QA which is likely to be in September/October 2021 – i.e. just over 6 months after census day
The options for delivering sufficient survey data to attempt to fulfil the requirement are:
- A smaller IPACS
If the sample were much smaller than currently proposed to enable it to be delivered, then the precision obtained would not be sufficient – the confidence intervals would be so wide that it could not be used to reliably detect any bias in the census estimates.
- Concentrated Population Coverage Survey around census day
Rather than developing an ongoing survey from the middle of 2020, a larger concentrated sample around the census day period could be designed. For example, the three months before and after. This means as the sample is much closer to the reference date a time series model would probably not be necessary, but would accept some small bias due to movers. However, the size would need to be large (probably 9,000 per month for 6 months) and would potentially conflict with the Census and CCS operations, as well as potentially conflicting with the ongoing LFS.
- Use the CCS
An alternative strategy is to use the existing CCS data collection which uses census day as its reference point. This has many advantages in that it achieves a high response rate, has the right reference point, collects the same data as the PCS, would result in a much simpler estimation method (a well understood DSE without any time series modelling), is being implemented anyway so has many practical advantages (in both collection and processing) and is likely to be large enough to achieve good confidence intervals.
However, it also has some drawbacks which are worth considering.
Firstly, there would be a concern over independence. If we are using the same survey to estimate the population using the census and then also using administrative data, are the two things independent? They would not be truly independent, but the key requirement is to have something which can help to highlight any residual biases in the 2021 Census estimates. These biases will come from a number of sources, and the main risks are around the DSE – and in particular assumptions of independence between Census and CCS, linkage error, heterogeneity of capture probabilities and over-coverage. The same risks would apply to the administrative based DSEs, however they would be different in nature – the independence assumption is likely to hold better but the heterogeneity may not hold as well (due to limited post-stratification options). Bias due to linkage error may also be different as the Census and CCS are designed to be linked whereas the administrative data and CCS were not, and lastly we expect the over-coverage risks to be higher for the administrative estimates.
Therefore, whilst the two estimates may not be independent, the potential biases that underpin them are likely to be different in nature. This makes comparisons between them complex, especially if the biases in the administrative based estimates are not well understood.
Secondly, the CCS is designed for measuring coverage of the census, not the coverage of administrative data. This does not mean that it cannot be used, it just means that the sample allocation will not be optimal and therefore the confidence intervals will be wider than they would be had it been designed for the admin data estimates. Post-stratification of the CCS sample for estimation using administrative data would be a standard strategy, and thus the loss of precision will depend on the sample sizes within those post-strata, and the correlation of the variability of the coverage patterns in the census with those in the admin data. However, the CCS is a large sample, and the sample design is relatively conservative (so that it has some protection against the census coverage patterns being different from those expected in advance) and it spreads the sample everywhere. Any loss in precision compared to a PCS is likely to be offset by the higher response rates, and not having to use a time series model.
Thirdly, the linkage of the CCS would need to be completed to meet the time scales. This needs to be considered, as the same accuracy as the census to CCS linkage requires is likely to be needed – and this is also happening at the same time. The Census to CCS linkage is the priority, and there does not appear to be the capacity to do another full high quality linkage exercise alongside this.
Fourthly, the CCS is more clustered than the design suggested for IPACS, so there may be a slight loss of precision which would need investigating. However, the overall sample size might well make up for this.
The key drawback of using the CCS is that if does not meet its success criteria (response rate of around 90 per cent with a minimum of 70 per cent in all LAs), then both the Census estimates and the administrative based estimates will both suffer in terms of bias and/or precision. Estimates can still be made, but there would be an increased risk of not meeting the bias targets or confidence interval targets.
It seems feasible to use the CCS to produce an administrative based population estimate given that an independent PCS of the right size is not possible within the timeframes. However, there is a risk of a lack of independence. Equally, the likely biases in the census and admin based estimates will be different although as this has not been explored previously we do not have any evidence for this. There are some advantages, in particular the closeness to the reference period, the likely simple (and understood) estimation methodology and the large sample size. The key question is whether it can deliver estimates which are both approximately unbiased and with confidence intervals sufficiently narrow that they can be used as evidence as part of the census national quality assurance.
Part 2 – Estimating population size using the CCS with limited clerical matching resource
As discussed in part 1, it might be feasible to use the CCS combined with administrative data to provide population estimates. In this section we explore a methodology for achieving this under reduced clerical matching constraints, and attempt to explore the quality loss.
It is anticipated that dual-system estimation could be used, as per previous census estimation methods. However, one of the requirements for this is for high quality individual level linkage between the two sources. On a full scale this would be challenging due to the likely timeframe clashing with the same linkage exercise for the CCS to the Census, which requires full matching with a high degree of accuracy. Clerical matching, in particular, would not be possible on a large scale. For the CCS to administrative data linkage, should a full and highly accurate linkage be required, it is likely to require more clerical effort than the Census to CCS.
An alternative is to accept a lower match rate (for example, by only using automated matching methods) which results in a high false-negative rate, and use a sample to estimate the matching error. The estimated matching error can be used to adjust the DSE for the bias induced by the false negative matching error. If the estimates of matching error are unbiased, this should result in approximately unbiased estimates (assuming all other sources of bias are also zero). However, the resulting estimates would have higher variance than if full matching were undertaken due to the additional sampling process. This could work in this scenario, because the requirement is to produce national estimates of population size by age and sex, rather than a full characteristic analysis of non-response as is the case for the Census to CCS linkage. This paper explores the loss due to the sampling to estimate the error levels, and the additional potential for bias in the estimates of matching error.
Racinskij (2020) outlines a general framework for adjusting DSEs based upon a sample which estimates matching error. In that framework both false positive and false negative errors can occur and the estimator accounts for both, requiring a sample that can detect both types of error. The sample is drawn from all records in one of the sources. The simple simulation study in that paper shows that for two sources with coverage rates of 90 per cent and 80 per cent respectively for a population of 1000, the usual DSE without matching errors is approximately unbiased and has relative standard error of 0.53 per cent. When linkage errors of 5 per cent false negatives and 2 per cent false positives are introduced, the DSE is then biased by 5.04 per cent and its RSE increases to 1.06 per cent. If a sampling fraction of 0.2 is used to draw a sample from the source with 90 per cent coverage (i.e. a sample size of 180 records), and the results used to adjust the DSE using the estimator in the paper, then the bias is reduced to 0.04 per cent (i.e. nearly unbiased) but the RSE increases to 1.74 per cent. Thus the RSE has trebled when compared to the ‘fully matched’ DSE alternative.
The concern with adopting this approach for producing population estimates from the CCS and administrative data is that the sample size required would still be infeasible to provide a reasonable degree of precision. For context, the census estimates based upon the CCS should attain an RSE of around 0.2% for a single age-sex group (ONS, 2012). Early estimates suggest that to obtain close to this level of precision, a sampling fraction of 0.5 might be required which is probably similar resource levels to doing full clerical matching.
Our proposal is therefore to adopt a conservative matching strategy which deliberately attempts to achieve zero false positives, at the expense of resulting in a high false negative rate. We expect this to result in match rates for individuals of around 80% between the CCS and administrative data, but the assumption is then that those matches will contain a negligible number of false positives which for estimation purposes can be ignored. Therefore, from a sampling perspective, we only need to sample unmatched records (and not draw a sample from all records) and carry out a clerical check of those to determine the false negative rate which is then used to adjust the DSE as per Racinskij (2020).
If we make assumptions about the designed ABPE under-coverage, the CCS coverage and CCS sample size we can use a slightly modified variance estimator based on Racinskij (2020) to show what the likely RSEs and Confidence Intervals will be for estimates of individual age-sex groups and for the sex ratios which would be used in the national adjustment. These will show the trade-off between the amount of clerical matching required under various scenarios and the likely quality of estimates.
The estimator is therefore as follows:

The estimated the DSE correction is:
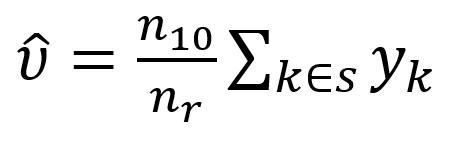
where
![]()
which is the Horvitz-Thompson estimator under SRS, sampling nr records from the unmatched records from source 1.
The variance, using the derivations in Racinskij (2020) is:
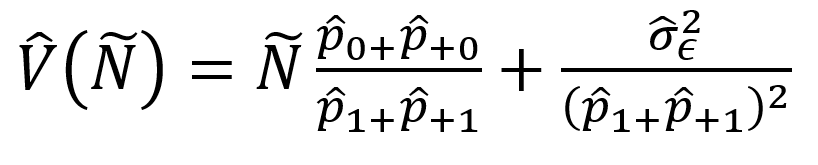
But this time the variance of the DSE correction estimated from the sample is:
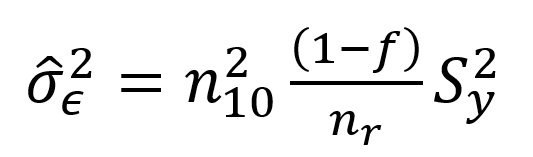
Where f is the sampling fraction, and as in Racinskij (2020) the sample variance replaces S2y. This variance will be smaller, as the sample is drawn only from the n10 unmatched records. This can now be used to calculate the variance associated with an error-corrected DSE under different sample sizes for estimating the false negative matches.
As a baseline, the Census and CCS achieve 94 per cent and 90 per cent coverage overall. The CCS sample size is around 500,000 individuals. The linkage achieved has very low error rates. Using the variance estimator described, for each of 34 age-sex groups with CCS sample size 15,000 individuals (so that the total CCS sample size is 500,000 individuals) the Relative Standard Error (RSE) on the DSE population estimate is 0.07 per cent. Note that the estimate has not been weighted up to the total population – that process adds additional variation which is not addressed in this paper. Variances for sex ratios can also be computed, assuming independence between the male and female estimates.
Table 1 overleaf shows how the RSE changes based upon the assumptions of coverage rates, false negative rate and sample fraction. We have tried to show a base scenario (#2) of 80 per cent admin data coverage, 90 per cent CCS coverage, a false negative rate of 0.2 and control the overall sample size to be around 20,000 records, which currently is our best guess on the capacity available for clerical resource. This base scenario gives an RSE of 0.51 per cent. Scenario 26 shows the approximate results for the Census to CCS matching under perfect conditions.
The table shows that as expected, the RSE increases as coverage rates fall, the false negative rate increases or the sample sizes fall. In particular, if more records have to be removed from the admin data to ensure there is no over-coverage, then the RSE could increase by up to 20 per cent (scenario 6). Equally, if the clerical capacity were to be only enough for around 11,000 records (scenario 24) then the RSE increases by 20 per cent.
Lastly, scenario 25 shows what might be possible if not all age-sex groups are considered, perhaps focusing on adult age groups up to the age of 50 only. Coverage rates will be lower for these groups but the increased sample size offsets this.
Table 1: Relative Standard Errors (RSE) for adjusted DSEs based upon various coverage, false negative rates, sample sizes and numbers of age-sex groups considered
| Scenario | Census/admin coverage | CCS Coverage | False Negative rate | Sample fraction | age-sex groups | Total FN sample | RSE |
|---|---|---|---|---|---|---|---|
| 1 | 0.9 | 0.9 | 0.2 | 0.16 | 34 | 20563.2 | 0.0045 |
| 2 | 0.8 | 0.9 | 0.2 | 0.18 | 34 | 20563.2 | 0.0051 |
| 3 | 0.75 | 0.9 | 0.2 | 0.19 | 34 | 20349 | 0.0054 |
| 4 | 0.7 | 0.9 | 0.2 | 0.2 | 34 | 19992 | 0.0057 |
| 5 | 0.65 | 0.9 | 0.2 | 0.22 | 34 | 20420.4 | 0.0059 |
| 6 | 0.6 | 0.9 | 0.2 | 0.24 | 34 | 20563.2 | 0.0061 |
| 7 | 0.8 | 0.85 | 0.2 | 0.15 | 34 | 19584 | 0.0059 |
| 8 | 0.8 | 0.8 | 0.2 | 0.14 | 34 | 20563.2 | 0.0064 |
| 9 | 0.8 | 0.75 | 0.2 | 0.15 | 34 | 20655 | 0.0068 |
| 10 | 0.8 | 0.8 | 0.2 | 0.14 | 34 | 20563.2 | 0.0064 |
| 11 | 0.75 | 0.75 | 0.2 | 0.13 | 34 | 19890 | 0.0076 |
| 12 | 0.7 | 0.7 | 0.2 | 0.13 | 34 | 20420.4 | 0.0087 |
| 13 | 0.65 | 0.65 | 0.2 | 0.13 | 34 | 20685.6 | 0.01 |
| 14 | 0.8 | 0.9 | 0.1 | 0.26 | 34 | 20155.2 | 0.0029 |
| 15 | 0.8 | 0.9 | 0.15 | 0.21 | 34 | 20134.8 | 0.004 |
| 16 | 0.8 | 0.9 | 0.25 | 0.15 | 34 | 19890 | 0.0064 |
| 17 | 0.8 | 0.9 | 0.3 | 0.13 | 34 | 19624.8 | 0.0077 |
| 18 | 0.8 | 0.9 | 0.35 | 0.12 | 34 | 20318.4 | 0.0087 |
| 19 | 0.8 | 0.9 | 0.2 | 0.35 | 34 | 39984 | 0.0034 |
| 20 | 0.8 | 0.9 | 0.2 | 0.3 | 34 | 34272 | 0.0038 |
| 21 | 0.8 | 0.9 | 0.2 | 0.25 | 34 | 28560 | 0.0042 |
| 22 | 0.8 | 0.9 | 0.2 | 0.2 | 34 | 22848 | 0.0048 |
| 23 | 0.8 | 0.9 | 0.2 | 0.15 | 34 | 17136 | 0.0057 |
| 24 | 0.8 | 0.9 | 0.2 | 0.1 | 34 | 11424 | 0.0071 |
| 25 | 0.75 | 0.8 | 0.2 | 0.28 | 18 | 20412 | 0.0049 |
| 26 | 0.94 | 0.9 | 0 | 34 | 0.0007 |
Figure 1 attempts to demonstrate how this might feed into the national adjustment process, by replicating the evidence that would be seen at the time. The chart shows the sex ratio information that might be presented prior to the national adjustment. It includes the 2011 Census count, the 2011 Census initial estimate (with CI), the Mid-Year population estimate, the Admin-Based population estimate V2 (which is the admin data attempt to measure the whole population without any form of coverage correction) and a made-up CCS corrected ABPE, but with the confidence interval based upon the base scenario 2 from Table 1. The Patient register and CIS sex ratios are not included for clarity, and as ABPE V2 essentially uses these in the main.
Figure 1 – Sex ratios in 2011 including mocked up ABPE-CCS sex ratio estimate with confidence interval
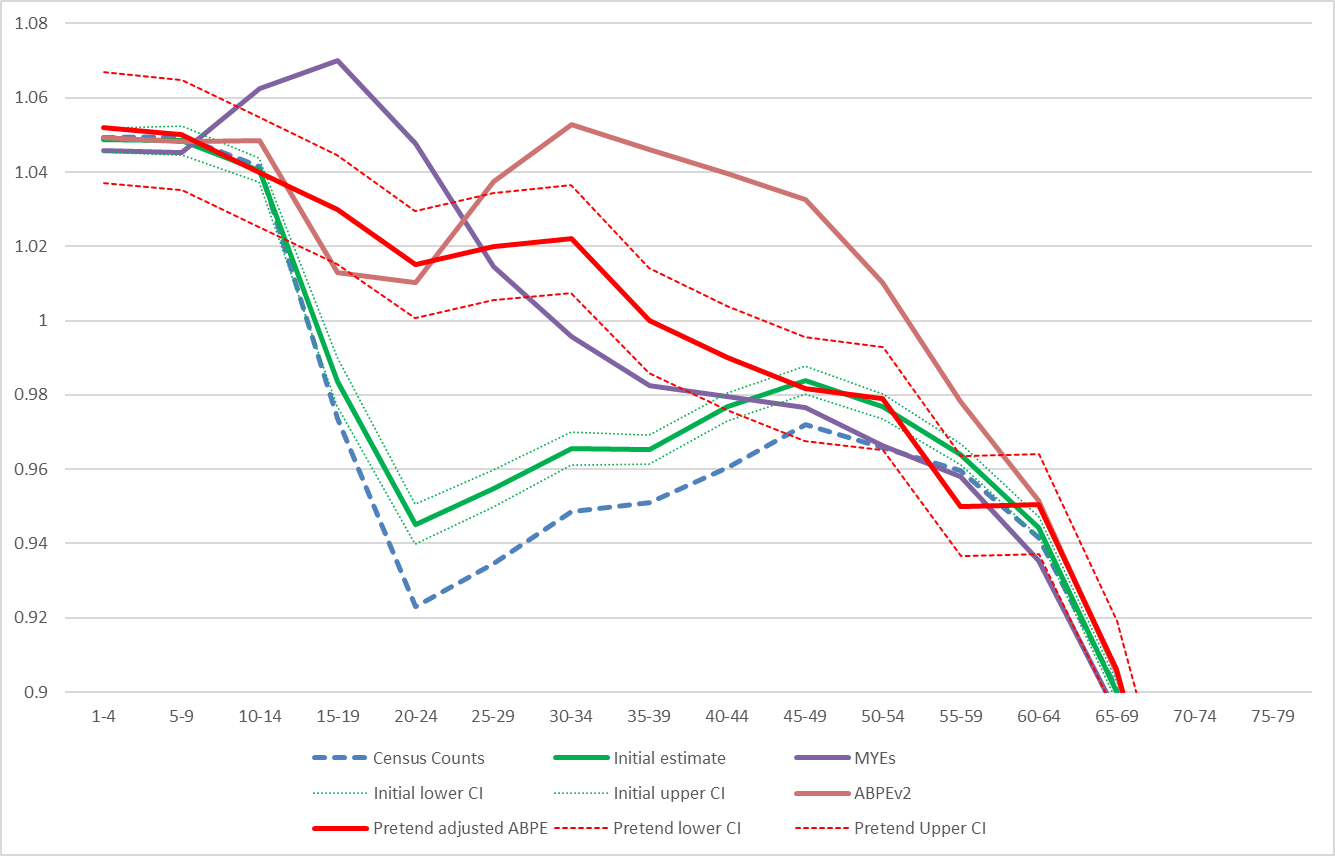
Figure 1 shows that whilst the confidence intervals are wide around the CCS adjusted admin-based estimate, it does provide some helpful information. However, were they to be wider than as shown, then the estimates might become less useful when using it to make decisions about whether to adjust the census estimates, and by how much. Given the estimated quality shown here is a likely underestimate, this work would suggest that the estimates would not be of sufficient quality to provide a benchmark sex ratio to adjust the census results to.
The precision presented here is likely to be an underestimate, as it assumes no further processes to extrapolate to the entire population. How much this would add is uncertain but would require additional research, and assumptions about the likely patterns in the administrative data. This would not be a trivial piece of work.
This also assumes that the only source of bias is due to linkage errors. Over-coverage in the administrative data is still a concern, and in order for this to be a useful exercise we need confidence that it can be removed. The sex ratio for the ABPEV2 in Figure 1 shows what can happen when there is over-coverage present in the administrative data (in this case Males aged 25 and over).
The approach also assumes that the matching results in zero false positives, and some evidence would be required to make a better assessment of this likelihood.
This paper presents some options for producing national level estimates of population size using administrative data combined with the CCS, under the assumption that a full accurate linkage process is not possible in time for feeding into the 2021 Census national adjustment process. The approach is to adopt a conservative automatic matching process, and then use a sample to estimate the false negative error rate to adjust the standard dual-system estimator.
There is a reduction is precision, and this raises the question of whether this renders the estimates useful within the national adjustment process. The tentative conclusion at this point, with a number of assumptions, is that it would be useful but not of sufficient quality to provide a target sex-ratio to adjust the Census to. Even so, it is highly dependent on the further removal of over-coverage from the administrative data, and confirmation of the likely linkage sample sizes that could be used. In addition, further work is required (see below) to fully scope out the likely precision and practicalities around linkage.
Double check the validity of the modification to the variance formulae.
Simulation of likely precision based on varying coverage rates across age-sex groups would also be required, as would consideration of the actual sampling strategy for false negatives. This may improve precision over the SRS results presented here.
Consideration of the conservative matching strategy and some testing of whether 80 per cent linkage with zero false positives would be achievable.
Additional estimation of the amount of clerical resources required and how the clerical verification of false negatives would work – for instance could the pre-search algorithm provide sufficient speed and accuracy, and thus is the anticipated sample size of 20,000 realistic in practice.
References
Abbott, Owen; Tinsley, Becky; Milner, Steve; Taylor, Andrew C.; Archer, Rosalind (2020) Population statistics without a Census or register. Statistical Journal of the IAOS. Vol. 36, no. 1, pp. 97-105.
Office for National Statistics (2012) Confidence intervals for the 2011 Census. Available at: http://www.ons.gov.uk/ons/guide-method/census/2011/census-data/2011-census-data/2011-first-release/first-release–quality-assurance-and-methodology-papers/confidence-intervals-for-the-2011-census.pdf
Racinskij, V. (2020). Naive linkage error corrected dual system estimation. Available at https://arxiv.org/abs/2003.13080