Written by Kamila Martyna
Purpose
The purpose of this paper is to present the proposed variability target for the 2021 Census.
Background
One of the Census quality targets for 2021 is reduced variability in response rates across Local Authorities (LA) and within Hard-to-Count (HtC) groups. The HtC index is constructed using an area level (Lower Super Output Area – LSOA) model that predicts non-response by day 10 after Census Day (Dini, 2018). Each LSOA is assigned a score from 1 to 5, with 1 being easiest and 5 hardest to enumerate.
The estimation strategy for the 2021 Census has changed from 2011 – in 2011 it was an area-based estimation (Abbott, 2008); in 2021 area is less important and estimation is more characteristic-based (e.g. based on age or ethnicity). However, controlling the variability across the characteristics would be almost impossible, and it is still important to reduce variability across the areas as much as possible. There is still a link between variability of responses and the quality of estimates, albeit smaller than in 2011. Therefore, reducing variability across the areas seems to be the best practical approach to undertake in 2021.
For this reason, we need a quantifiable approach to track our progress against the quality target of reduced variability. During the 2011 operations the method used was that 90% of LSOAs fall within 10 percentage points (hereby referred to as pp) of the mean response rate for that Local Authority, and Hard-to-Count group.
The approach using pp difference from the mean is fixed; the range around the mean is always 10pp, regardless of what mean rates are. The % approach will have different ranges for different mean response rates. For example, if HtC 3 achieves a mean response rate of 85%:
- the pp range around the mean will be 75% – 95% (85% +/- 10pp);
- the % range around the mean will be 76.5% – 93.5 (85% +/- 10%*85%).
A retrospective analysis was performed to evaluate if the 10pp target was met in 2011, and if a more ambitious goal is feasible to aim for in the 2021 Census – 90% of LSOAs falling within 10% target range of the mean response rate. Alternative targets were also investigated as possible variability goals for 2021.
It is also important to mention that our predictions for the response rates for the 2021 Census are more uncertain than for 2011 due to the online-first approach. The online-first Census could lead to higher variability; therefore, it is important to choose a target that is not overly stretching in case the variability behaves differently than in 2011.
The proposed idea is to use a similar but more challenging method to the one used during the 2011 operations – 90% of Lower Super Output Areas (LSOA) should fall within 10% of the mean response rate for that Local Authority, and Hard-to-Count group.
Discussion
Hard-to-Count variability
The boxplot below shows the distribution of LSOA response rates within each HtC group in 2011. A general trend of increased variability can be observed as willingness to respond decreases.
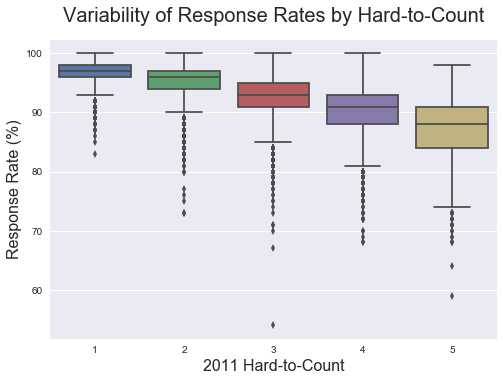
The analysis of the response rates showed that both 10pp and 10% targets were acheived in 2011 – for all HtC groups more than 90% of LSOAs had response rate within 10pp/10% of the mean response rate for that HtC. The 9pp target was achieved in all HtC groups; the rest of the targets were not met in one or more HtC groups – the response rates were too varied and didn’t fit the target range around the mean.
Proportion of LSOAs that were witin the 10/5 variability target.
| HtC 1 | HtC 2 | HtC 3 | HtC 4 | HtC 5 | |
|---|---|---|---|---|---|
| 10pp target | 0.9995 | 0.9957 | 0.9806 | 0.9765 | 0.9452 |
| 10% target | 0.9995 | 0.9957 | 0.9806 | 0.9684 | 0.9099 |
| 9pp target | 0.9991 | 0.9938 | 0.9723 | 0.9684 | 0.9204 |
| 9% target | 0.9991 | 0.9938 | 0.9723 | 0.9663 | 0.8407 |
| 8pp target | 0.9986 | 0.9907 | 0.9639 | 0.9543 | 0.8655 |
| 8% target | 0.9986 | 0.9907 | 0.9636 | 0.9484 | 0.7885 |
| 5pp target | 0.9908 | 0.9564 | 0.8841 | 0.8321 | 0.6031 |
| 5% target | 0.9908 | 0.9543 | 0.8229 | 0.7689 | 0.5666 |
Local Authority variability
Similar analysis on the variability of LSOA response rates within Local Authorities showed that all but the 5pp/5% targets were met in 2011.
Proportion of LAs that were within the 10/5 variability target.
| Percentage of LAs | ||
|---|---|---|
| 10pp target | 0.9971 | |
| 10% target | 0.9885 | |
| 9pp target | 0.9885 | |
| 9% target | 0.9885 | |
| 8pp target | 0.9885 | |
| 8% target | 0.9856 | |
| 5pp target | 0.8764 | |
| 5% target | 0.8276 |
Field Prioritisation Algorithm (FPA)
FPA is a tool designed by Census Statistical Design team with the aim of reducing variability (Meirinhos, 2019). Its goal is to reduce variability between and within HtC groups in each Team Leader Area (an area where Census Officers have agreed to work in). It works by targeting the worst performing Output Areas and giving them priority of field visits, and giving no visit priority to the best performing areas.
Regardless of which variability target will be decided for the 2021 Census, we won’t stop reducing variability with FPA just because we have reached that target. We will continue to target the areas with the lowest return rates throughout the operational period – even if we don’t decide for more demanding targets, we might reach them because of the FPA.
Despite the variability goal being easier to achieve for the easier-to-count areas, the FPA will work continuously to minimise variability. It is feasible to set harder to achieve goals for the FPA, as there is no downside to having a more challenging target in the FPA (as long as it’s not extremely difficult because that would work at the expense of maximising response).
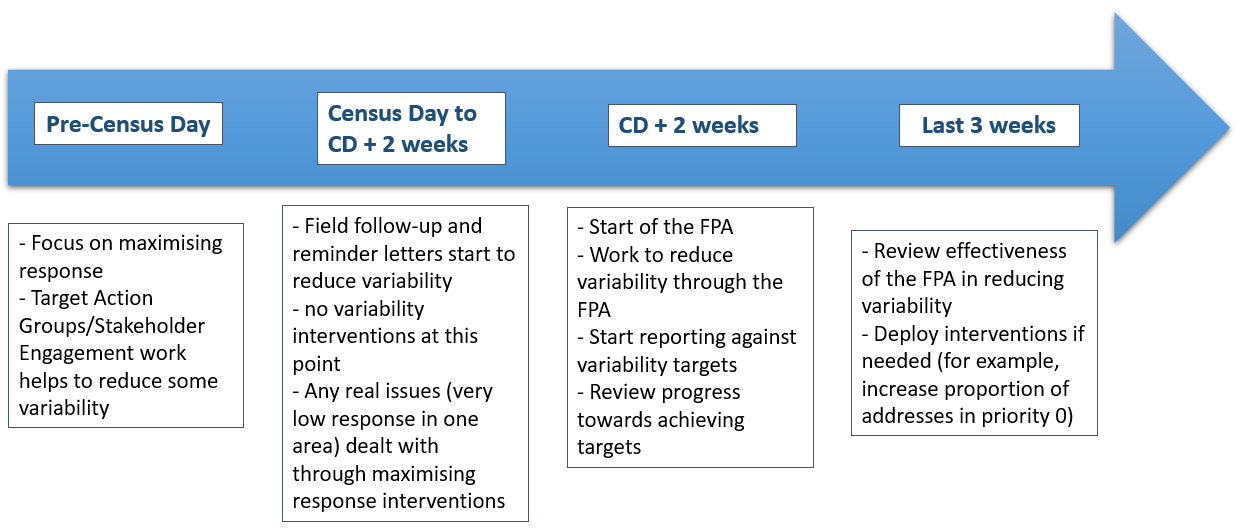
Variability Timeline
Throughout the operational period, we will undertake different actions to minimise variability in 4 phases, and to evaluate how we are performing against our variability targets:
- Before the Census Day our main focus will be on maximising response by engaging with specific populations. We expect variability to be large.
- From Census Day on, we will be focusing on maximising response – no variability interventions will be implemented at this point (any reduction in variability will come from maximising response interventions).
- From 2 weeks after the Census Day, the FPA will start working to reduce the variability. We will also start reporting against the variability targets.
- In the last 3 weeks of operations, we will review the effectiveness of the FPA and adjust how it works if needed.
The variability target is used for reporting and as an objective measure of variability – it will not be used to guide the field behaviour. It works separately to the FPA, which will directly influence the field activities.
Conclusion
In summary, the 2011 target should be an acceptable minimum target. Variability is very important, but we want it to be achievable. We propose that the 10% variability goal should be used in 2021. This goal is sufficient to meet statistical requirements as agreed with the Methodology team. It is more operationally feasible than the 8 and 5 pp/% targets, but more challenging than the 10pp target used in the 2011. The 9% goal was met in 2011, however, due to some uncertainty of the online-first nature of 2021 Census it might be more challenging to meet that goal in 2021. Finally, regardless of the target chosen, the FPA will not stop reducing variability during live operations, even if the variability target was met.
List of Annexes
Not applicable.
References
Abbott, O. (2008). 2011 UK Census Coverage Assessment and Adjustment Methodology. Census Advisory Group paper (08)05.
Dini, E. (2018). EAP102 – Hard to Count index for the 2021 Census. https://uksa.statisticsauthority.gov.uk/methodological-assurance-review-panel-census/papers/
Meirinhos, V. (2019). EAP115 – Field Prioritisation Algorithm. https://uksa.statisticsauthority.gov.uk/methodological-assurance-review-panel-census/papers/