1. Critical data gaps - Under-counting of at-risk populations
The mandatory character of the census, and the high levels of cooperation from the public, mean that the census provides an invaluable check on the extent of under-coverage of populations at risk of disadvantage, discrimination or marginalisation, and of individuals with protected characteristics, both in ONS surveys and in administrative statistics. Following each census, the ONS has regularly compared the results from its principal surveys with those in the census and can therefore check the representativeness of the survey data, and enable the latter to be corrected, for example by weighting. Similarly, new linked administrative datasets will also need to be checked and corrected if there are undercounts or overcounts.
The evidence that is set out in the Consultation Document (PDF, 1334KB), and more detailed evidence provided to us by ONS in the release Developing admin-based ethnicity statistics (ABES) for England and Wales: 2020, suggests that there is an important issue of undercounting of ethnic groups in the current version of the ABES. In comparison with some other protected characteristics, ethnicity is covered in detail in several administrative datasets (such as the school census in England) and robust estimates of some of the larger groups are available. We are therefore concerned that the problem of undercounting may be even greater for other protected characteristics such as disability.
However, even in the ABES, ethnicity is available only for 85% of the individuals included in the dataset Population and migration statistics transformation, ethnicity, England and Wales Refusals (at around 10% of the total) are the largest contribution to this undercount. Furthermore, within England, the extent of the undercount varies greatly between local authorities, the proportion for whom ethnicity is available in the ABES ranging from 45.4% in City of London to 94.2% in East Devon. This could have major potential implications for the accuracy of the data at lower geographical levels. While the ABES can certainly provide estimates at local authority level, the value of these estimates to users is greatly diminished if there are serious doubts about their accuracy.
1(a): Signals of disproportionate disadvantage
It is generally found that individuals for whom data is missing are not a random sample of the group but are disproportionately disadvantaged: in other words, there is a risk of bias in the results. The Consultation Document (PDF, 1334KB) addresses this by helpfully comparing ABES results with 2021 Census results. While at a highly-aggregated level the results from the two sources are fairly similar, even at this level there is a shortfall of non-White groups in the ABES. Thus, in England, 9.6% of the population were categorized as Asian in the 2021 Census whereas in the ABES only 8.9% were categorized as Asian. This 0.7 percentage point discrepancy amounts to nearly 400,000 people, given an overall population of just under 56 million in England. If we look at ethnicity at a more granular level, we find some even larger proportionate shortfalls for members of the Roma and Arab groups in the ABES data (0.3% of the England population being identified as Roma/Traveller in the 2021 Census but only 0.1% in the admin data – a shortfall of around 100,000 people). Roma and Travellers are among the most disadvantaged ethnic minorities in the UK; they are also important from a planning point of view, such as the need for campsites. So a major undercount of Roma and Travellers, and of other marginalized or vulnerable groups, in the ABES data is likely to have major real-world implications for policy-makers. The proportionate shortfall is even greater in the case of Arabs – 0.6% of the population being identified as Arab in the 2021 Census but only 0.1% in the admin data. This is apparently because some key admin datasets do not offer the option of Arab in the list of ethnic groups.
1(b): Insufficient research progress
Figure 9 in the Consultation Document indicates that research progress on ethnic groups is ‘mature’ while coverage is only ‘partial’.
Figure 9: Research on the availability of administrative data sources and their expected coverage varies by topic
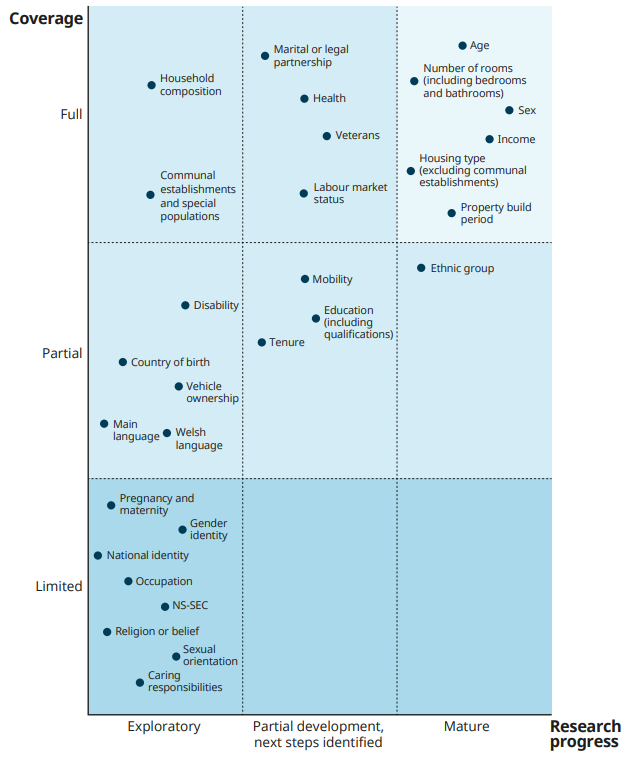
Source: Office for National Statistics, Future of Population and Migration Statistics Consultation Document
We also note, with concern, that research progress on characteristics such as Disability, Gender Reassignment, Pregnancy and Maternity, Religion or Belief, and Sexual orientation is still only ‘exploratory’, and for most of these the coverage is ‘limited’. In fact, a total of 8 / 29 characteristics are both at the exploratory research stage and have limited coverage, of which 5 are protected characteristics under the 2010 Equality Act.
Our understanding is that some protected characteristics have no or very limited inclusion in administrative dataset, as shown in the ONS Equalities data audit. The Equality Impact Assessment published alongside the ONS proposals is not reassuring on this score. It appears that ONS plan to rely wholly or partly on survey data such as the Labour Force Survey or on new benchmarking surveys, not on administrative data, for religion, sexual orientation, and gender identity. There is some lack of clarity in the Consultation Document, but our understanding is that these characteristics will not be included in the proposed admin-based alternatives to the census.
While survey data are undoubtedly a valuable supplement to the census for analyses of inclusivity, the small sample sizes of even the largest surveys means that reliable estimates at a local authority level will not be possible. Furthermore, there are major issues about declining response rates to surveys, potentially introducing undercounting just as in the case of administrative data (see further below). So we are concerned that the issues identified above with respect to ethnicity could be magnified in the case of these other protected characteristics, resulting in critical data gaps.
Other important categories with respect to inclusivity such as Caring responsibilities, National identity, and Socio-economic background also appear to be at the exploratory/limited stage of development. In fact, of the 29 characteristics identified in the Consultation Document’s Figure 9, only 6 have both Mature research and Full coverage, namely Property build period; Housing type (excluding communal establishments); Income; Sex; Number of rooms (including bedrooms and bathrooms); and Age.
We acknowledge that ONS, in partnership with administrative data providers, has already made substantial progress in improving the coverage of ethnicity in the administrative data, and we expect that more progress can be made in future. But it is not yet clear to us, since analysis is only at an exploratory stage, how large the current undercounts in administrative data are for the other protected characteristics, how much progress in improving administrative data can reasonably be anticipated in the foreseeable future, how valid and reliable survey-based estimates will be in the absence of accurate administrative data, and how ONS proposes to combine survey-based with admin-based data. It appears that many issues still need to be resolved.
1(c): Inclusivity and methods for addressing critical data gaps
We understand from ONS that a variety of modelling methods is currently being considered for dealing with these critical data gaps, as set out in the SPD Estimation Options paper (PDF, 1271KB). We agree that modelling techniques can be helpful for dealing with problems such as missing data (such as item non-response). But it is not clear to us how modelling could be used to fill the critical data gaps in the administrative data with respect to religion, sexual orientation and gender identity. Moreover, these methods can be highly complex and will typically depend on assumptions that cannot be independently verified.
It is outside our remit to review these methods in detail but from the point of view of inclusivity, four considerations will need to be kept in mind:
Small communities:
Some groups or categories, such as Roma, gender reassignment, or specific types of disability, may be quite small in the population and thus will need very large (and therefore expensive) samples in order to obtain reliable estimates, both in the survey and a fortiori in the modelled administrative data. This could also be a challenge for data about shifting identities, for example, recent refugee groups from “Asian Other” to “Hong Kongers”, or from “white” to “Ukrainians”, as well as data about how identities might change over time or have different patterns in different age groups.
Intersectionality:
Typical sample surveys are too small to enable reliable checks for intersectionality, and hence it will be difficult to adjust the administrative data in such a way as to have confidence in the results of intersectional analysis of the admin dataset. In other words, the adjusted administrative data may be reliable if one is simply interested in univariate national-level statistics, but could be increasingly unreliable for more granular, disaggregated or intersectional analyses. This is likely to be a particular issue for small local area analyses.
Definitions:
It is likely that adjustments to the administrative data will be more accurate if there is a close fit between the definitions used in the survey and those used in the collection of administrative data (which is probably the case for ethnic group). But the greater the mismatch between the administrative definitions and the Equality Act definitions, as will be the case with respect to disability for some administrative datasets such as Department for Transport’s data on disabled parking badges, the weaker will be the statistical model that is being used to adjust administrative data.
Response rates:
Declining survey response rates mean that the sample surveys which might be used to adjust or supplement the administrative data, such as the Labour Force Survey, may themselves be biased, perhaps increasingly so over time. It is noted that response rates to the Labour Force Survey (LFS) declined from 50% in 2013 to 17% for the Q1 of 2023, partly due to the move to online data collection during the Covid pandemic. While we would certainly welcome new large-scale and regular surveys designed to provide high quality measures of the distribution of protected characteristics in the population, we doubt if they will fully compensate for the absence of the census or if they will have the same authority with the public that census results have. They may also prove to be prohibitively expensive, cancelling out any cost savings from discontinuing the census.
Back to top