Dear Lord Bridges,
When giving evidence to you and your Committee on 18 April, Grant and I promised to follow-up on a number of points with various members of the Committee.
Firstly, we promised to send the Office for National Statistics (ONS) and OECD joint study, International comparisons of the measurement of non-market output during the COVID-19 pandemic, which compared methodologies used by national statistical institutes; and Lord King also asked if we could share our Public service productivity, healthcare, England bulletin.
You asked if we were able to conduct a comparison of other countries that do use the direct measurement approach for healthcare and how they fared during the pandemic. The following charts relate to international comparisons of countries that use the direct volume output measurement approach to healthcare: the use of activity data.
International comparisons of healthcare specifically are limited partly as many countries do not publish data by individual industries such as healthcare. Figure 1 shows the Gross Value Added (GVA) of a broader group of industries: human health, education and public administration. This industry grouping is reported to the OECD and so available for a wider group of countries. Only countries that measure health care on a direct volume output basis are included in Figure 1.
Figure 1 shows a greater fall in the UK than other countries in these three industries combined. This will partly be due to differences in the measurement and output of education services over the pandemic, but healthcare will also be a factor. Gross value added for healthcare for the UK is in part supressed because of the large increase in intermediate consumption – the goods and services used as inputs, such as personal protective equipment. While the GVA of healthcare is now lower than it was before the pandemic, the ONS measures of the volume output of government in healthcare show this to be higher than before the pandemic.
Figure 1: Gross value added from health care, education and public administration combined for countries that use the direct volume output method for health care
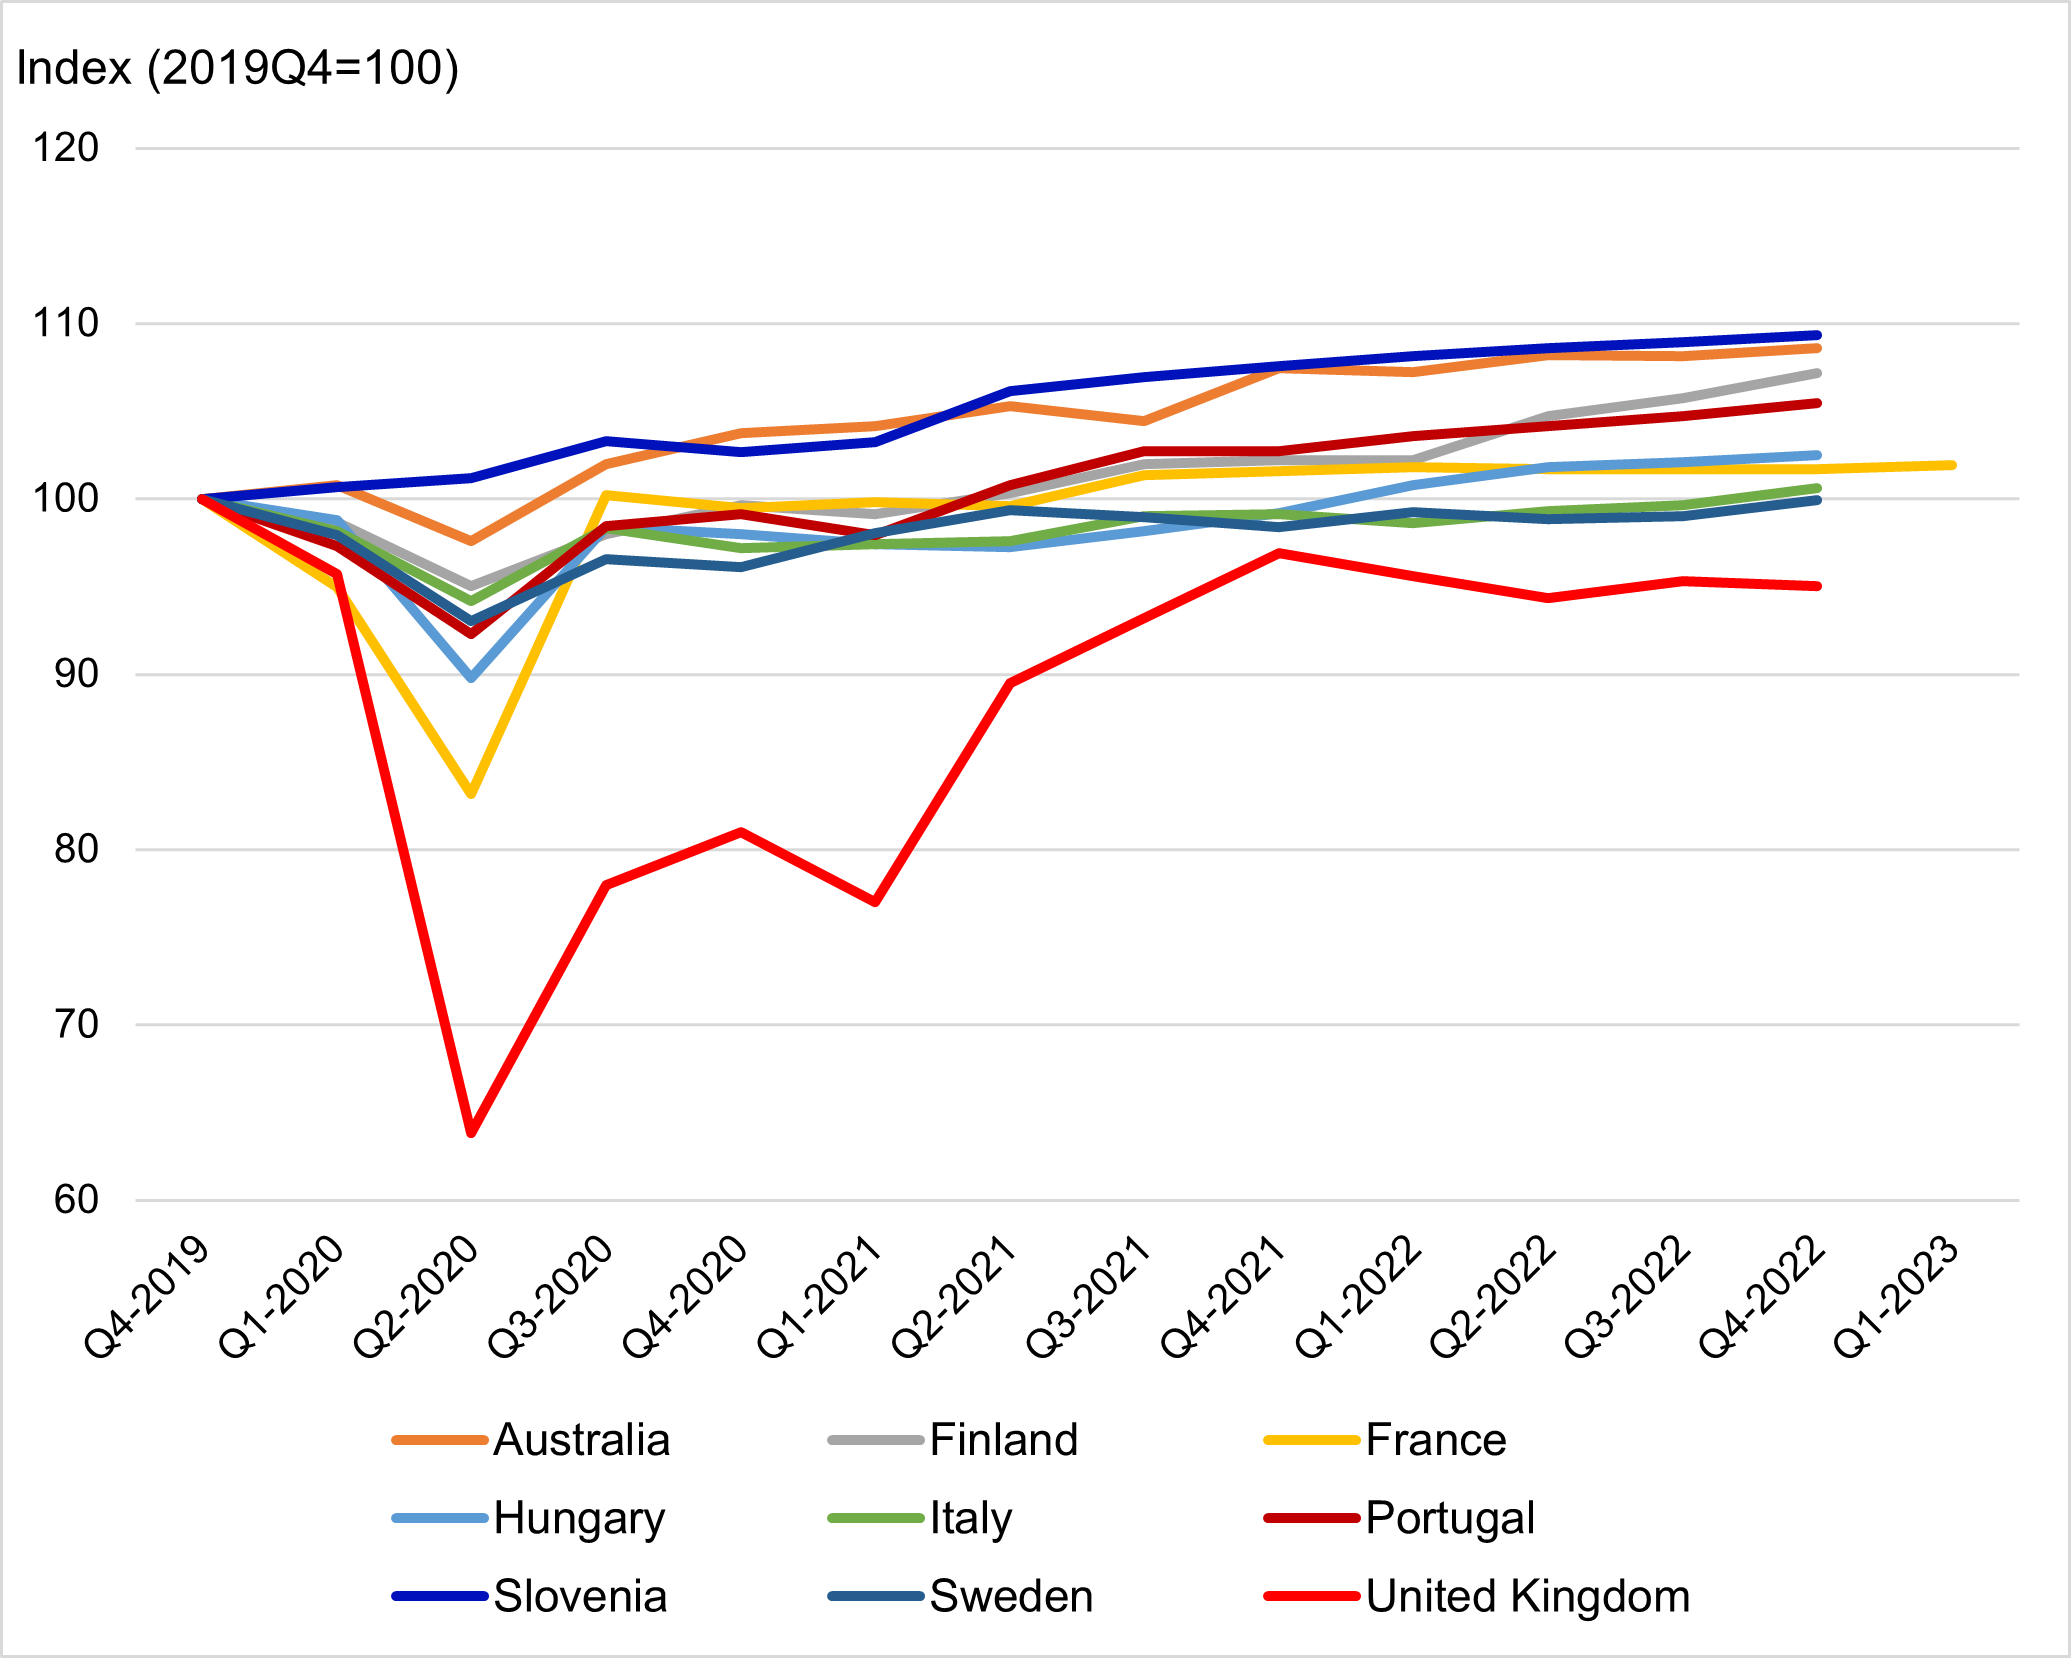
Source: Office for National Statistics For a more accessible version, please visit our accessibility policy.
Figure 2 shows the output of government services provided to individuals (such as healthcare and education) unadjusted for intermediate consumption. Again, this measure is an imperfect comparison, particularly as the proportion of healthcare that is government-funded varies greatly between countries. However, for the UK, the coverage of this measure and the three industries included in Figure 1 substantially overlap. Figure 2 shows less of a difference between the UK and other countries, with the total output of government-funded services at a similar level to before the pandemic for the UK.
Figure 2: Individual consumption expenditure of general government, chained volume estimates for countries that use the direct volume output method for health care
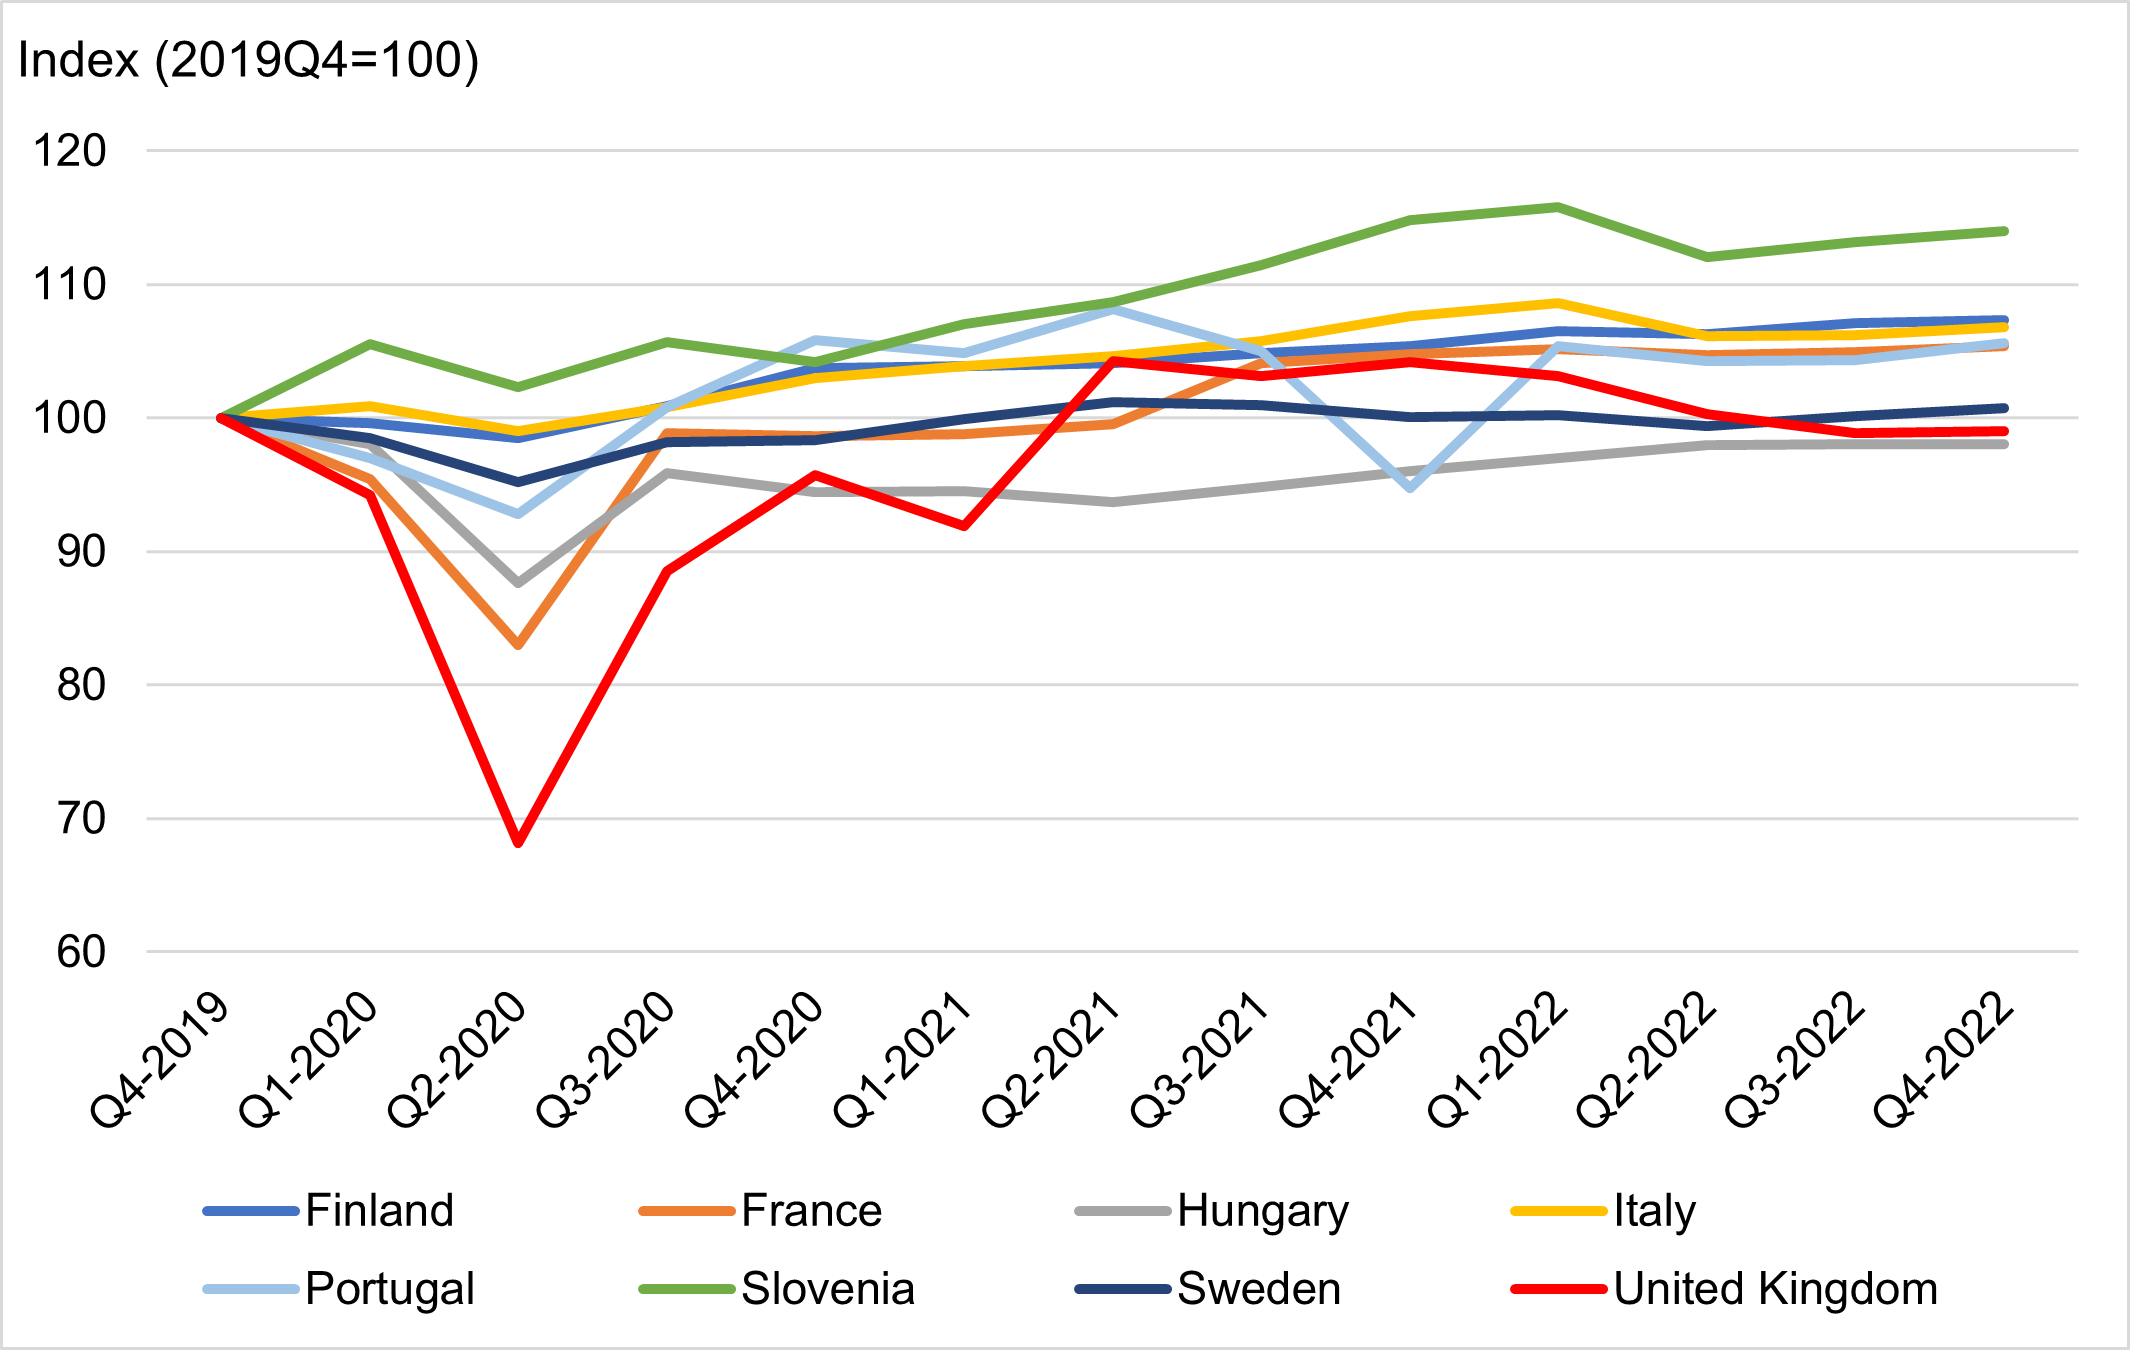
Source: Office for National Statistics For a more accessible version, please visit our accessibility policy.
In addition, while discussing healthcare, Lord Davies asked if we ensure that the two sets of figures between private and public provision make sense. For healthcare, we have separate data sources for public and private provision, and for private provision we collect data via a survey where respondents can add comments. For example, during the recent nurses’ strike, there were stronger numbers for the private healthcare section which made reference to increased numbers of people deciding to attend private healthcare. Ultimately, if public healthcare provision is doing well, with good outcomes and short waiting lists, then people have less incentive to use private provision and there is only a finite amount of healthcare needed so the two will offset each other to some degree.
Lord Rooker discussed life expectancy, specifically if has stalled for the first time in 120 years and whether this has had an impact on business (particularly the funeral industry). We agree that in the most recent period of 2018-20, compared with 2015-17, male life expectancy at birth was 7 weeks shorter and for females there was almost no change. Since 2010-12 life expectancy has grown by 0.3 years for males and females, compared with an increase of 2.5 years for males and 1.7 years for females between 2000-02 and 2008-10.
In terms of the impact on the funeral industry, funeral care is included within a more general heading of ‘other personal care’, so the data are not separately identified. As this industry includes hairdressers (who were severely impacted by the pandemic) we did not see large growth overall.
While discussing measurement of the digital economy, you asked how other countries gather statistics on how people spend their time. The UK is particularly active in the UN-led process around updating the System of National Accounts (SNA) in the area of digitalisation and the treatment of free digital products as described by Lord King in his example. UK officials led, with the US Bureau of Economic Analysis, the development of guidance on how to treat free digital products in a satellite account, potentially as part of the unpaid work satellite account and were recently asked to take on the lead editorship of a manual providing guidance to national statistics institutes on the correct treatment of these products, recognising that the production costs and income derived from their production is already included in the national accounts.
The UK also chairs the development of guidance on the treatment of unpaid household service work with the SNA. Within those guidance notes recommendations is a proposition to include the time spent in paid work, unpaid work and leisure time within a supplementary table. This would then allow users to better consider factors like leisure time which have an impact on personal well-being when also evaluating changes in the value of the economy, while including or excluding the value of unpaid household services in their appraisals. We hope that the next SNA will therefore allow a better understanding of how households are experiencing their time, while also complementing existing measures of GDP with more complete measures of output including more traditional unpaid household services, and those which are digitally mediated, as captured by the new UK Time Use Survey.
The ONS ran a pilot online Time Use Survey in March 2020 which has since evolved over five successive surveys, with the latest undertaken in March 2023. The survey not only records all the activities carried out in a respondent’s day, but also captures how much they enjoyed the activities and the extent to which they were using smart devices to engage in them.
As a result of the Covid-19 pandemic, time use analyses produced by the ONS throughout 2020 to 2022 were focused on meeting policy interests in how the public were spending their time and changing behaviours during periods of lockdown and periods where restrictions were eased.
However, moving on from the pandemic, we are now refocused on using this source in measuring the digital economy, and are reviewing existing methodologies for the measurement of unpaid household production activities (as outlined in the UNECE Guide on Valuing Unpaid Household Service Work), including those used in compiling the UK Household Satellite Accounts, last published in 2018. We endeavour to produce new estimates up to 2020 during summer 2023 and then aim to start developing new methods utilising the time use data collected since 2020 for more recent years immediately afterwards.
From 2023/24 onwards, the Time Use Survey will be run twice per year as part of the Economic Statistics Centre of Excellence (ESCoE), and we will be collaborating with academic experts in producing new experimental estimates of unpaid household production work, with an ambition to produce quarterly estimates in the future which would coincide with quarterly GDP estimates.
Finally, Lord Turnbull asked for information directly after the session on a) what proportion of health and education sector are non-market outputs, and b) how treated GPs, including those working in the NHS – i.e. private sector or non-market healthcare output, and c) likewise for dentists. In the Blue Book 2022, we provide rounded figures of the splits for health, social care and education: health is split 85/15 public/private, social care is 50/50 public/private (we publish human health and social care) and education is 69/8/23 public/private/other (this includes higher and further education). If there is market activity (i.e. private sector activity within our health data) we treat this as a P11 transaction, which is classed as market output and is deducted from our final consumption exemption figure for Government output. This would apply for GPs and dentists.
Please do let us know if any other questions, and if we can help the Committee further on either this topic or any of its other inquiries.
Yours sincerely,
Mike Keoghan
Deputy National Statistician for Economic, Social and Environmental Statistics