Dear Chair,
Following the appearance of Rob Kent-Smith and I before the Committee for the inquiry considering Regional Imbalances in the UK Economy on 30 October, members sought further detail on regional price indices, the link between regional investment and regional productivity, and our future plans for regional statistics.
We are providing this information to assist with this inquiry and would be very happy to provide further clarification and advice on any points of interest to the Committee, as required.
Yours sincerely,
Darren Morgan
Director, Economic Statistics Development
Office for National Statistics
Regional Imbalances in the UK Economy
Regional price indices
The Consumer Prices Index, including owner occupiers’ housing costs (CPIH), is used to measure consumer price inflation in the UK. The CPIH has been designed to measure inflation from a national United Kingdom perspective. Users of price statistics have, for a long time, suggested that regional indices of consumer prices would be valuable in helping to understand how inflation varies across the UK, and whether there are important differences in regional inflation.
The Office for National Statistics (ONS) recently commissioned research by Southampton University to investigate the potential for using the existing consumer price collection to support the calculation of regional price indices and to assess the level of quality of regional indices that could potentially be produced.
The initial report included a set of rudimentary regional price indices, which can be seen at Figure 1, at the ‘all items’ level (that is, a CPIH for each region). The report concluded that provisional regional indices, while somewhat useful, were unreliable due to a number of factors: small samples of prices in each region and volatility in the regional baskets and weighting underpinning the calculations. Several recommendations were put forward that would help improve the reliability of the regional indices.
Figure 1: Provisional regional CPIH for 2010 to 2017
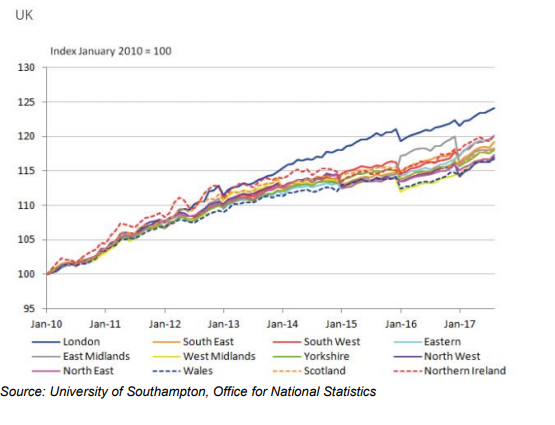
Further research is taking place to investigate the options for implementing these recommendations. An initial update was published in 2019, that assessed the impact of applying statistical modelling techniques to the calculation of regional baskets and weights to reduce the volatility seen in the initial research. This is being followed up during 2019/2020, looking at the options for improving the amount of price sample available in each region to hopefully improve the quality of regional indices.
At this stage, given the quality issues identified with the production of regional price indices, we are unable to confidently publish regional indices at a more detailed product level, such as for childcare or the leisure industry.
Link between regional investment and regional productivity statistics
Our conversation during our oral evidence focussed on investment and as discussed, allocating investment on a regional basis is challenging, particularly investment in things that are intangible. While we haven’t done any analysis on the link to productivity, one element of this investment is research and development where we do produce a regional estimate. These data show research and development by business is largest in the East of England and South East, where levels of productivity are comparably high.
Future for regional statistics
To provide robust, timely and accurate data that will meet the needs of regional policymakers and other local users, we must address two aspects: first, the need for economic statistics to monitor the performance of business, trade and government intervention at a local level; and second, the need for statistics to monitor social and environmental issues affecting communities across the UK.
For economic statistics the ultimate model is the full National Accounts framework used to estimate UK national GDP, which pulls together all the aspects of economic flows of income, expenditure and output into a cohesive picture, supported by detailed statistics on the availability of labour and pricing effects. The core of this framework is the ‘Supply and Use Tables’ (SUT) that are used to confront a range of data sources to arrive at a fully reconciled ‘balance’ of all of the flows in local economies. These tables are used as the basis for analysis that allows policymakers to estimate the impact of interventions on different parts of the economy (known as ‘input-output’ analysis).
The Digital Economy Act 2017 has made it possible for us to gain access to various administrative data sources that were previously inaccessible for statistical purposes. We have been exploring the potential of these data to help us strengthen the regional statistics we already produce, allowing us to provide reliable estimates for smaller areas and to populate parts of the Supply and Use framework. We have already made significant progress using VAT returns to help monitor economic activity in local authorities, and we are now looking to expand this to provide even smaller ‘building blocks’ that can be used to construct any area of interest to local policymakers.
Other data sources are being looked at with a view to informing a similar breakdown to local areas for our household income and expenditure measures. Of these, PAYE data and credit/debit card transactions have been identified as having great potential to improve the coverage of small areas. We have also identified administrative sources with the potential to help us address parts of the framework that we do not yet cover at a regional level, for example, the use of Corporation Tax returns to provide insight into the capital expenditure and investments made by business.
If all of these data driven developments can be achieved, we will have filled most of the missing parts of the SUT framework at a regional level. The only major components that would then be needed are measures of trade between regions of the UK, and regional prices information to be able to deflate the data to remove the effect of inflation and provide estimates in ‘real terms’.
Trade between regions is a particular problem. We know of no administrative data that capture these flows, and there are currently no surveys that collect this information in a consistent way across the whole UK. The devolved administrations of Scotland, Wales and Northern Ireland have all carried out their own surveys to collect information on trade between their respective countries and the rest of the UK, but this still leaves a rather large gap in the data. To do this effectively and most efficiently would entail a UK-wide survey run by the ONS to collect information on business flows between all regions of the UK, which we plan to do subject to an evaluation of affordability in light of future spending review settlements.
As aforementioned, research work on regional prices is already underway and we expect this to provide a workable basis for the development of regional price indices covering both consumer prices and producer prices within the next few years. With all of these developments we could produce SUT for all the remaining countries and regions of the UK (Scotland and Northern Ireland already have them), and also for any other sufficiently large area that has a need for the policymaking tool that is provided by inputoutput analysis. By this we refer to the Combined Authorities with elected mayors, which have been granted devolved powers that need comprehensive economic monitoring. The SUT would provide regional policymakers with the detailed structural information they need to monitor the performance of their economies. However, there is an inherent time lag in such comprehensive data. For timely monitoring of economic performance we have developed quarterly measures of regional GDP for the countries and regions of the UK, in collaboration with the devolved administrations.
The logical extension of this work is to develop similar timely indicators for smaller geographic areas, starting with Combined Authorities and potentially going down to local authority level, so that all regional and local policymakers might have access to the same level of support from economic statistics. The administrative data have the coverage to enable this. The challenge lies in the resource needed to compile and provide briefing on so much additional information.
An advantage that flows from having enhanced data at local levels is that it allows for improved evidence on policy topics that impact places and the people living within them. Work has already been carried out at the ONS compiling data and evidence on topics that are of specific interest to regional policymaking at the present time such as regional disparities, towns and high streets. This work is to be continued and the increased availability of administrative data and economic indicators for smaller geographic areas will enable such analysis to be further developed in the future.
Furthermore, the developments in economic statistics outlined above are to be complimented by improvements in social and environmental statistics. Analysis of place often works best when it can combine economic statistics with social and environmental indicators and, to enable this, there is work taking place at the ONS to further develop regional statistics on social and environmental topics. For example, enhanced subnational data has recently been provided on topics such as wellbeing, ageing, housing, natural capital and population, whilst a range of regional data is also being compiled as part of the Sustainable Development Goals (SDGs).
Looking forward, the 2021 Census will provide a wide-range of demographic and social data for small areas enabling analysis on a range of topics relevant to local policymakers including household characteristics, population, housing and transport. In addition, and similar to the approach for economic statistics, there is an intention to make far more use of administrative data sources in compiling demographic and social statstics in the future. The aim here is to enable data for small-areas to be available on a more regular basis, and not just limited to once a decade. A number of Administrative Data Research Outputs have been published in recent years that illustrate developments in this area, while programmes to transform Census and social surveys are being developed that will integrate increased administrative data into the future production of social statistics for regions and smaller geographic areas.
Related Links:
- Office for National Statistics written evidence to the Treasury Committee as part of their inquiry: Regional imbalances in the UK economy (August 2019)
- Office for Statistics Regulation written evidence to the Treasury Committee as part of their inquiry: Regional imbalances in the UK economy. (June 2019)
- Office for National Statistics and Office for Statistics Regulation oral evidence to the Treasury Committee as part of their inquiry : Regional imbalances in the UK economy. (October 2019)
- Office for Statistics Regulation follow-up written evidence to the Treasury Committee as part of their inquiry: Regional imbalances in the UK economy. (January 2020)