Dear Mr Stride,
Thank you for inviting me to give evidence for the Committee’s inquiry on the economic impact of coronavirus on 20 January. While speaking to the Committee, I promised to provide further information on the comparability of GDP figures between countries; more specifically on approaches for measuring the output of the public sector.
In response to the increased interest in UK GDP compared to other countries, we have published an article today that looks at international comparisons of GDP. This explores, in full, the different changes in GDP between the UK and the other G7 countries.
The article is quite lengthy, but following my comments at the Committee, there are two particular comparisons I would draw you to. The first focuses on the difference between the ‘real’ and ‘nominal’ measure of GDP. GDP captures the value added through the production of goods and services in a country in a given period of time. GDP is recorded in current prices, often referred to as ‘nominal’, and in volume terms, often called ‘real’. The current price estimates simply record the value of output, income and expenditure. If we consider output, current price GDP can rise because we produce more goods and services, or because the prices of those goods and services are rising. The volume estimate of GDP takes out the effect of price rises and tends to be the headline estimate, and so typically is the focus for international comparisons.
The difference in practices for recording public sector output between countries only affects comparability of the headline volume or ‘real’ estimates of GDP. Current price or ‘nominal’ estimates of GDP are not affected and therefore more internationally comparable, but such comparisons do not always capture all the features of government services provided in the volume estimates. Figure 1 shows that while the UK’s performance on the volume measure is the weakest, the current price measure puts the UK in a much more comparable position.
The second comparison, at figure 2, looks at countries’ performance in terms of volume or ‘real’ GDP, if we remove all Government expenditure from the measure of GDP. While this also removes the effect of different practices for recording public sector output, it obviously means an important part of the economy is ignored. As the chart below shows, while this approach makes little difference to the fall in UK GDP, for other countries it makes the falls in their GDP substantially larger therefore narrowing the gap between the UK and other countries. The ‘volume GDP w/ GGFCE’ includes Government spending, while the ‘w/o GGFCE’ series excludes Government spending.
Figure 1: International comparisons of GDP highlight how the UK has been hit relatively worse than other advanced economies
Current price and volume G7 GDP, Quarter 4 2019 to Quarter 3 2020
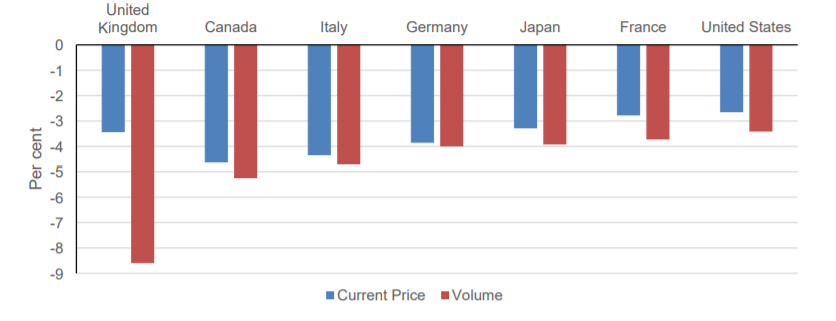
Source: Office for National Statistics, Organisation for Economic Co-operation and Development
Figure 2: The recording of volume estimates of government consumption expenditure has an impact on the size of the shortfall in GDP for other G7 countries
Volume G7 GDP, Quarter 4 2019 to Quarter 3 2020
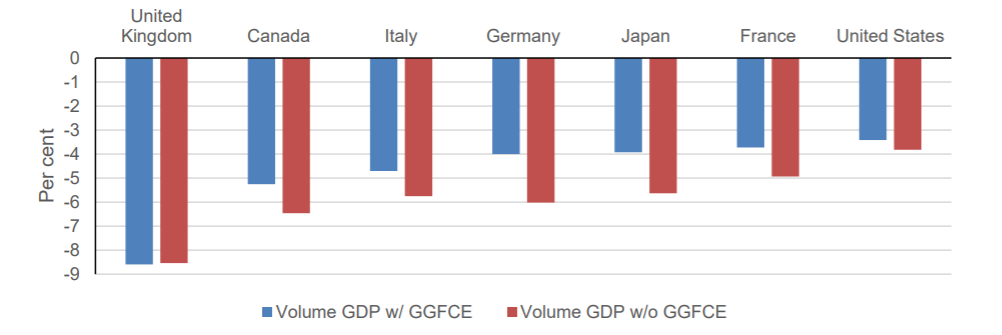
Source: Office for National Statistics, Organisation for Economic Co-operation and Development
I also mentioned that we would share the direct and indirect impacts of COVID-19 on excess deaths and morbidity December 2020 update as soon as it was published, which we did on 29 January. Please do let me know if I can be of any further assistance to the Committee.
Yours sincerely,
Jonathan Athow, Deputy National Statistician and Director General, Economic Statistics Office for National Statistics