Dear Lady Parminter,
I write in response to the Environment and Climate Change Committee’s call for evidence for the inquiry into behaviour change in the context of climate change and the environment.
As the Committee may be aware, the Office for National Statistics (ONS) is the National Statistical Institute for the UK and the largest producer of official statistics. The ONS aims to provide a firm evidence base for sound decisions and develop the role of official statistics in democratic debate.
Climate change is an increasingly high priority area for policymakers and the public. In the lead up to the UN climate conference COP26, the ONS has responded to user demand for insights, including on individual and business attitudes to climate change and behaviours including actions taken or not taken. This included developing new questions for inclusion on our rapid response surveys, first introduced during the COVID-19 pandemic, and synthesis of a range of existing statistics.
We have focussed this written evidence on recently published insights into public attitudes towards climate change, and related lifestyle changes in response to climate change, and the latest insights on the actions of businesses to reduce carbon emissions.
We are continuing to develop our statistics and insights, including addressing data and analytical gaps, while also where possible improving the granularity and timeliness of our outputs, building on feedback from users from across government and beyond. In addition, the ONS led cross-government collaboration on the UK Climate Change Statistics Portal launched as a prototype ahead of COP26. This brings climate change related statistics from across government together in one place for the first time, giving clear, accessible and accurate information. We are continuing to develop the portal and we would be happy to update the Committee as this work progresses.
I hope this analysis is useful to the Committee. Please do let me know if we can provide any further assistance to this inquiry.
Yours sincerely,
Liz McKeown
Office for National Statistics (ONS) written evidence – Behaviour change in the context of climate change and the environment
Public attitudes
In November, the ONS published an article on public attitudes to the environment and the impact of climate change in Great Britain, using data collected in the Opinions and Lifestyle Survey (OPN). In October 2021, three-quarters (75%) of adults in Great Britain said they were either very or somewhat worried about the impact of climate change, while around one-fifth (19%) said they were neither worried nor unworried.
Around 8 in 10 women (79%) reported being either very or somewhat worried. This was statistically significantly higher than the proportion of men reporting this (72%).
Just under a quarter (24%) of those aged 70 years and over reported being very worried, compared with 37% of those aged 25 to 34 years and 34% of those aged 35 to 49 years. For those reporting some level of worry (either very or somewhat worried) there was no significant difference between age groups.
Among adults in younger age groups who were relatively unworried or ambivalent about climate change, the most common reason was not knowing much about climate change (62% of those aged 16 to 24 years and 49% of those aged 25 to 34 years). Younger adults were less likely to report thinking that there were other more urgent priorities to worry about (28% of those aged 16 to 24 years and 27% of those aged 25 to 34 years).
Anxiety about the future of the environment
In October 2021, 43% of adults in Great Britain reported having been very or somewhat anxious about the future of the environment over the past month. A further 37% reported being neither anxious nor unanxious, with 20% reporting being somewhat unanxious or not at all anxious.
As illustrated in Figure 1, proportions of women saying they were very anxious were similar to those for men, although the somewhat anxious figure was slightly higher for women (37%) than men (31%).
Adults in younger age groups appeared to be more likely to report feeling not at all anxious, compared with older age groups. Among those aged 16 to 24 years, 22% reported being not at all anxious compared with 9% among those aged 70 years and over.
Figure 1: Proportion of adults (aged 16 years and over) and level of anxiety about the future of the environment over the past month, by demographic, Great Britain, 6 to 17 October 2021
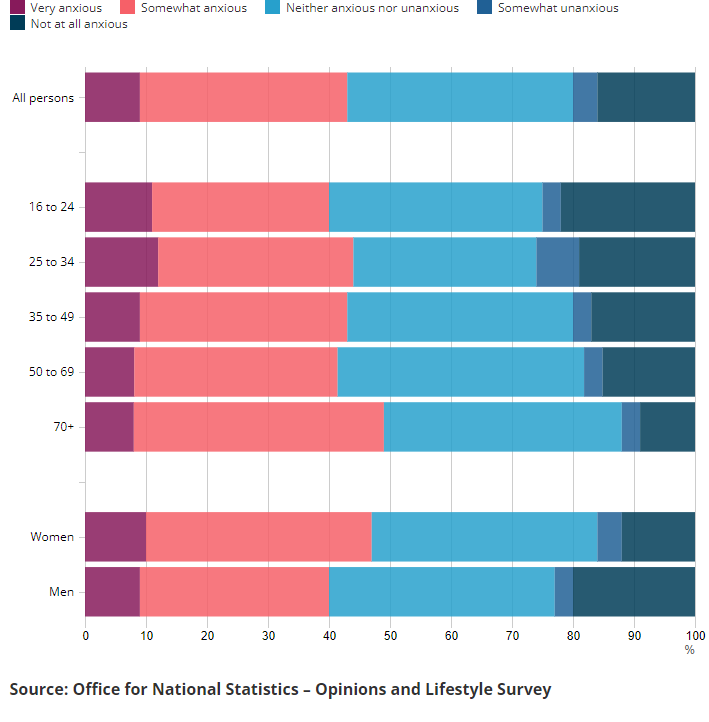
Source: Office for National Statistics – Opinions and Lifestyle Survey. For a more accessible version, please visit our accessibility policy.
Lifestyle Changes
According to the OPN in October 2021, 81% of adults in Great Britain reported having made some or a lot of lifestyle changes to help tackle climate change. A fifth of adults (19%) in October 2021 reported having made no lifestyle changes to help tackle climate change. Adults who reported some level of worry (either very worried or somewhat worried) about the impacts of climate change were three times more likely than those who were relatively unworried (not at all worried or somewhat unworried) to have made a lot of changes to their lifestyle to help tackle the issue.
As shown in Figure 2, one in eight of those who reported some level of worry (12%) said they had made a lot of lifestyle changes, compared with 4% of those who were relatively unworried. Of adults who reported some level of worry, 9 in 10 (90%) said they had made some or a lot of changes to their lifestyle. This compares with 55% of those who were relatively unworried and 52% of those who were neither worried nor unworried.
Women were more likely to have made lifestyle changes (85%) than men (77%). A higher proportion of men reported having made no changes (23%) compared with women (15%).
Adults in the oldest and youngest age groups appeared slightly less likely to report having made lifestyle changes (74% of those aged 70 years and over and 77% of those aged 16 to 24 years). Around 8 in 10 of those in other age groups reported this.
The most common reasons for not having made lifestyle changes were believing large polluters should change before individuals and believing their actions would not make a difference (both 33%).
Figure 2: Proportion of adults (aged 16 years and over) who made lifestyle changes to help tackle climate change, by demographic and level of worry, Great Britain, 6 to 17 October 2021
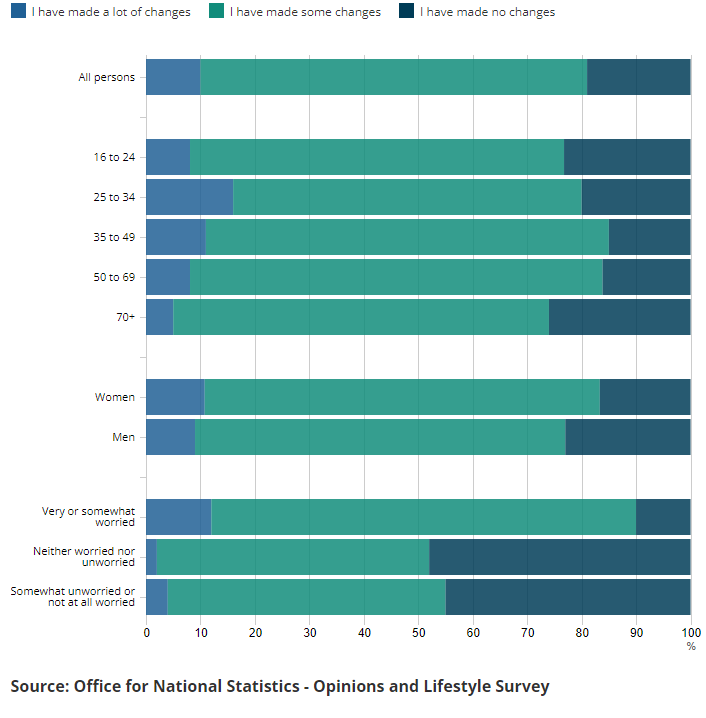
Source: Office for National Statistics – Opinions and Lifestyle Survey. For a more accessible version, please visit our accessibility policy.
Use of low emission vehicles
Among adults in Great Britain surveyed between 22 September and 3 October 2021, 44% of all petrol, diesel and hybrid drivers said they were either likely or very likely to switch to an all‑electric vehicle in the next 10 years, as the sale of vehicles reliant on fossil fuels is set to end by 2030. More than 4 in 10 of those likely to switch to electric (41%) are expected to do so in the next five years.
In 2020, ownership of privately licensed plug-in vehicles was more common in UK local authority areas with a higher gross disposable household income per person. Only one of the 20 local authority areas with the highest proportion of plug-in vehicles had an annual gross disposable income per head below the UK median of £20,237 (The Orkney Islands). All others were in London, the East or South of England. Kensington and Chelsea, the area with the highest annual gross disposable household income per head (£85,376) other than the City of London, had the second highest rate of licensed plug-in vehicles per 100 households (2.4) in the UK.
Review of household behaviour
In November 2021, we published a review of household behaviour drawing on other government departments’ outputs, including the Department for Business, Energy and Industrial Strategy’s Public Attitudes Tracker, the Department for Environment, Food and Rural Affairs’ waste from households data, Department for Transport aviation emissions statistics, as well as Waste and Resources Action Programme data.
Energy consumption
Overall energy consumption in the UK has fallen 13%, from 224.6 million tonnes of oil equivalent in 1990 to 195.3 million tonnes of oil equivalent (Mtoe) in 2019. In 1990, energy consumption from fossil fuels contributed to 92% of total energy consumption, which had fallen to 80% by 2019. ONS statistics show that the share of renewable energy has increased from 1% in 1990 to 13% in 2019.
Households remained the highest users of fossil fuels in the UK in 2019, using 52 Mtoe. This is compared with the energy, manufacturing, and transport and storage sectors in Figure 3.
Figure 3: Fossil fuel energy usage for the four highest users in the UK, 1990 to 2019

Source: Office for National Statistics, Ricardo Energy and Environment. For a more accessible version, please visit our accessibility policy.
Fossil fuel use in the energy supply sector (electricity, gas, steam and air conditioning supply) has declined from 56 Mtoe in 1990 to 24 Mtoe in 2019. Fossil fuel use by the manufacturing sector has also been falling in recent years. This is largely because of a switch from the use of coal to other, more resourceful fuels such as natural gas.
Fossil fuel usage in the transport and storage sector has increased from 22 Mtoe in 1990 to 27 Mtoe in 2019. At its highest in 2007, fossil fuel use in this sector was at 31 Mtoe and has been steadily in decline since then. However, the same data suggest energy usage from fossil fuels by households has shown little decline overtime.
Food waste
The UK produced around 9.5 million tonnes of food waste in 2018, or the equivalent of 143 kilogrammes per person. This is down 15% from 11.2 million tonnes of food waste in 2007, an equivalent of 181 kilogrammes per person. In 2018, the majority of this food waste, 70% of the total, was from within households. Their share is slightly down from 72% in 2007.
Business actions to reduce carbon emissions
Wave 41 of the Business Insights and Conditions Survey (BICS), which was live for the period 4 October to 17 October 2021, asked businesses which had not permanently stopped trading whether they had taken any actions to reduce their carbon emissions, and if anything had prevented any such actions being taken. Questions on net zero appear every 4 waves in the BICS.
Of businesses not permanently stopped trading, approximately 37% reported taking at least one action to reduce their carbon emissions, with 28% reporting they have no emissions, 22% reporting that no action had been taken, and the remaining businesses reporting not sure.
The arts, entertainment and recreation industry and the professional, scientific and technical activities industry reported the largest percentages of having no carbon emissions at 47% and 38%, respectively.
Among not permanently stopped trading businesses that reported having carbon emissions (including those not sure), nearly a third (32%) also reported there was nothing preventing them from reducing their carbon emissions. A further 38% were not sure if action was being prevented. The most reported issues preventing action were the cost of implementation for the business at 18% and being unsure of how to measure their emissions at 11%.
Those not permanently stopped trading businesses that reported having carbon emissions (including those not sure) were also asked which methods had been used to assess the impact of climate change on their ability to operate; businesses responded:
- not conducted any assessments (70%) with the art, entertainment and recreation industry reporting the highest proportion (90%)
- not sure (24%) with the other service activities industry reporting the highest proportion (36%)
- assessment of demand for goods or services (3%) with the other service activities industry reporting the highest proportion (13%)
- technological assessment (2%) with the other service activities reporting the highest proportion (7%)
- flooding risk assessment (1%) with the other service activities industry reporting the highest proportion (7%)
- resource efficiency assessment (1%) with the real estate activities reporting the highest proportion (5%)