Dear Mr Crabb,
I write in response to the Welsh Affairs Committee’s call for evidence for the inquiry into the impact of population change in Wales.
As the Committee will be aware, the Office for National Statistics (ONS) is the UK’s National Statistical Institute (NSI) and largest producer of official statistics. We aim to provide a firm evidence base for sound decisions and develop the role of official statistics in democratic debate.
ONS are responsible for collecting and publishing statistics related to the economy, population and society at national, regional and local levels. We also conduct the census in England and Wales every 10 years. As you may know, we are currently consulting on the future of population and migration statistics in England and Wales. Our statistical releases include a range of outputs covering Wales, which we hope will be of assistance to the inquiry.
In line with our role as NSI, we produce many of our detailed statistics to reflect the overall population and economy of Wales and these releases therefore do not always cover detailed exploration of all reasons and decisions contributing to overall trends and patterns.
An overview of population change in Wales
On Census Day, 21 March 2021, the size of the usual resident population in Wales was 3,107,500; this was the largest population ever recorded through a census in Wales. The population of Wales has grown by 44,000 (1.4%) since the last census in 2011, when it was 3,063,456. This compares with intercensal change between 2001 and 2011 of 5.3 per cent (from an estimated 2.9 million in 2001). Census 2021 shows the rate of population growth in Wales was considerably lower than in England, where the population grew by 6.6%. Population growth was also lower in Wales than in all English regions.
Over the 10 years between 2011 and 2021, the mid-year population estimate for England increased by 6.5% to an estimated 56,536,000, the highest rate of the four countries of the UK; the estimated population of Northern Ireland increased by 5.0% to 1,905,000, Scotland by 3.4% to 5,480,000, and Wales by 1.4% to an estimated 3,105,000.
Figure 1: The population continues to increase in Wales: Population 1801 to 2021, Wales
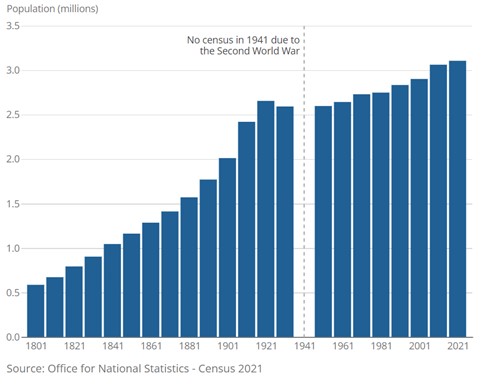
Source: Office for National Statistics – Census 2021 For a more accessible version, please visit our accessibility policy.
We are continuing to develop our research into the new dynamic population model (DPM), which aims to estimate population and population change in a timely way, to better respond to user needs. We have used the DPM to produce admin-based population estimates (ABPEs) for mid-year 2011 to 2022 for all 331 local authorities in England and Wales.
Population of Wales by age group
Census 2021 data shows that the trend of population ageing has continued, with more people than ever before in the older age groups. Over one-fifth (21.3%) of the Welsh population in 2021 (662,000) were aged 65 years and over, up from 18.4% (562,544) in 2011. The size of the population aged 90 years and over (29,700, 1.0%) has increased since 2011 (when 25,200, 0.8%, were aged 90 years and over). Nearly two-thirds (62.2%) of the Welsh population (1,931,800) were aged 15 to 64 years. The size of this age group has declined slightly since 2011, when 64.7% of the overall population (1,981,784) were aged 15 to 64 years. The remaining 16.5% of the population (513,800) in Wales were aged under 15 years. The size of this age group has also decreased since 2011, when 16.9% (519,128) were aged under 15 years, reflecting a decrease in fertility since 2011.
Our mid-year population estimates releases provide median ages. The median age of the population in the UK was 40.7 years in mid-2021, a year higher than in mid-2011. Wales had the highest median age in mid-2021 at 43.1 years. Median age can also be found in some of our census releases.
Components of changes in Wales’s population, including insights from Census 2021
Monthly data show that from April 2011 until the end of March 2021 in Wales there were 321,000 live births and 332,000 deaths registered. This represents a natural decrease of approximately 11,000 usual residents. The population growth since 2011 is because of positive net migration (approximately 55,000 usual residents) into Wales. Out of the estimated 3.1 million usual residents in Wales in 2021, 2.9 million (93.1%) were born in the UK and 215,000 (6.9%) were born outside the UK. The number of residents in Wales born outside the UK has increased by 28.3% (48,000) between the 2011 Census and Census 2021. In England, the number of residents born outside the UK has increased by 33.6% (2.5 million).
As part of the Census 2021 releases we have developed an interactive tool to enable users to understand how the population has changed in different local authority areas and how they compare with others across England and Wales. ONS have published insights from Census 2021 on People in England and Wales with a different address in the UK a year before the Census. This shows that the proportion of usual residents living in Wales on Census day 2021 with an address in England one year ago was 1.8%; this compares to 1.7% in 2011. The proportion of usual residents living in England on Census day 2021 with an address in Wales one year ago was 1.4% (the same as in 2011).
The highest net inflows on Census day 2021 (usual residents an address elsewhere in England and Wales one year ago as a proportion of usual residents age one year and over) were in student areas, which was similar to 2011. The local authority in 2021 with the highest net inflow in Wales was Ceredigion (2%). The local authority with the highest net outflow in Wales was Wrexham (0.3%).
Between 2011 and 2021, the proportion of people moving within their region decreased across all regions in England and Wales, with Wales having the largest percentage point difference which decreased from 8.7% to 7.1%. All local authorities in Wales saw a decrease of within local authority moves between 2011 and 2021, with the largest percentage point decrease being in Newport which decreased from 6.4% to 4.4%.
ONS mid-year population estimates and components of population change
ONS mid-year population estimates (MYEs) enable a detailed exploration of the components (sometimes also known as ‘drivers’) of population change (births, internal migration, international migration and deaths). Components of change for non-rebased data (2012 to 2020) show the following general trends regarding internal and international migration. Internal migration (to / from Wales from the rest of the UK) has generally been:
- very strongly net positive for Higher Education student ages
- very strongly net negative for graduate ages (some of which is likely to be a consequence of the strong inflow of people to study),
- net positive for families (internal migration for children and adults over 27/28 are both positive), and;
- net positive for older adults (through to the oldest ages).
ONS statistics on internal migration do not provide any information about people’s motives for moving (variables available are origin, destination, age and sex).
International migration (into Wales from the rest of the world) has generally been net positive and so contributing to the population aged under 25 with outflows at slightly higher ages related to inflows. Comparison of fertility in Wales to other parts of the UK over time can be made through using ‘Vital statistics in the UK: births, deaths and marriages’.
Detailed data from reconciliation and rebasing of mid-year population estimates
Following Census 2021, ONS have been completing a reconciliation and rebasing process. Reconciliation is the process of comparing the new official MYEs for mid-2021 (derived from using Census 2021 data), with the MYEs for mid-2021 which would have been developed in the absence of a census (mid-2021 estimates rolled forward from mid-2020 estimates). Rebasing follows on from the reconciliation process and aims to spread the differences observed out across the last decade in a plausible fashion (to reflect years of the decade when a component of change was contributing to that difference), apportioned to the most likely component of change.
Release of rebased mid-year population estimates from this process has been postponed to ensure population estimates are consistent with migration statistics this autumn. We will confirm publication dates in due course. Reconciliation and rebasing happens every 10 years following the census and is particularly important following Census 2021 because the coronavirus (COVID-19) pandemic is likely to have increased the uncertainty around the mid-year population estimates (MYEs) more than would ordinarily be the case. It is likely that many people’s movements over the last two years may not reflect longer-term trends. Census 2021 gives us the end-point population level for the decade since 2011. This means we are now able to compare the MYEs throughout the previous decade with the Census 2021 data and use these data to revise the timeseries of previous MYEs (including the components of change in these). The official population estimates for mid-2012 to mid-2020 will be revised, to incorporate the data we now have available from Census 2021.
Economic activity and inactivity in Wales
The latest labour market indicators for Wales including employment, unemployment, economic inactivity, workers’ hours, jobs and Claimant Count, rolling three-monthly figures are published monthly. For a comparison to other areas please see the regional, local authority and parliamentary constituency breakdowns of changes in UK employment, unemployment, economic inactivity and other related statistics (Labour market in the regions of the UK: September 2023). More detailed labour market indicators for local authorities, unitary authorities, counties and regions in Great Britain for a 12-month period, published quarterly (from the Annual Population Survey) can be found in the release LI01 Regional labour market: local indicators for counties, local and unitary authorities. Furthermore, annual population survey data on economic inactivity by reason by region can be found on Nomis.
Population projections for Wales
There are two population projections for Wales – national population projections (NPPs) and subnational population projections (SNPPs). These statistics are widely used in planning; for example, fiscal projections, health education and pensions. NPPs are produced by ONS and provide an indication of the potential future population size of the UK and its constituent countries. During the period mid-2020 to mid-2030, the population of Wales is projected to grow by 3.2%. SNPPs for Wales are produced by the Welsh Government and provide an indication of the possible size and structure of local authorities in Wales in the future.
Ongoing liaison with users of population statistics in Wales
The ONS Local team has a Devolved Liaison Officer for Wales who is working with Welsh Government and other stakeholders to offer a bespoke service in Wales. This service aims to help stakeholders navigate the ONS data landscape and access the data, analysis and insights they need to make decisions.
I hope this evidence is useful to the Inquiry. Please let us know if there is anything further we can provide.
Yours sincerely,
Emma Rourke
Deputy National Statistician for Health, Population and Methods