Dear Ms Nokes,
I write in response to the Women and Equalities Select Committee’s call for evidence for their inquiry into the “Rights of Older People”.
As the Committee will be aware, the Office for National Statistics (ONS) is the UK’s National Statistical Institute (NSI) and largest producer of official statistics. We aim to provide a firm evidence base for sound decisions and develop the role of official statistics in democratic debate.
Census provides an in-depth picture of the intersectionality of people aged 65 years and over in England and Wales, showing a high proportion have disabilities or provide unpaid care. The characteristics of people aged 50 years and over highlight that older people are becoming more diverse and policy for older people will need to consider this in coming years.
Regarding participation in the labour market, the Over 50s Lifestyle Study found that workers who have workplace support are more likely to stay in the workforce. Flexible working is seen as the most important reason for choosing to return, with levels of support differing across industries. Health also seems to be a barrier to re-entering the workforce, with over a half of workers who had left the workforce but not returning, reporting having current physical and mental health conditions. Additionally, productivity has fallen, and economic inactivity has risen among 50—64-year-olds.
Intersectionality:
Census 2021
The census currently provides the most detailed snapshot of the entire population, with the same core questions asked to everybody across England and Wales. The UK Statistics Authority has assigned National Statistics status to Census 2021 outputs, providing assurance that these statistics are of the highest quality and value to users.
Census 2021 achieved a very high response rate of 97%. We ensure the census results reflect the whole population by using statistical methods to estimate the number and characteristics of adults who were not recorded on a census response.
Quality considerations along with the strengths and limitations of Census 2021 more generally, are provided in our Quality and Methodology Information (QMI) for Census 2021.
Intersectionality can be explored further using our Create a custom dataset tool. This allows the user to select multiple variables to explore the characteristics of the population of England and Wales.
The following section is based on England and Wales only, as the ONS delivered Census 2021 in England and Wales. National Records of Scotland are due to publish multivariate outputs from Scotland’s 2022 Census in winter 2024/25, and Northern Irelands 2021 Census results are available from Northern Ireland Statistics and Research Agency.
An ageing population
Census 2021 results show that the population of England and Wales has continued to age since 2011. The number of people aged 65 years and over increased from 9.2 million in 2011 to over 11 million in 2021 and the proportion of people aged 65 years and over rose from 16.4% to 18.6%. In 2021, 38.0% of people living in England and Wales were over 50.
Over half (54.2%) of people aged 65 years and over in 2021 were female. The proportion of the population who are female increases with age; 81.0% of centenarians (aged 100 years and over) were female.
Age and sex by disability
Analysis published by the ONS demonstrates that the proportion of people who are disabled increases with age, and a higher proportion of females have disabilities at older ages than males. For example, of all females aged 55 to 59 in England, 22.7% were disabled, compared with 19.0% of males of the same age. The same pattern is seen in Wales. Of all females aged 55 to 59 in Wales, 27.6% were disabled compared to 23.2% of males. As this population gets older, so does their likelihood of being disabled. You can explore this in more detail in our Disability by age, sex and deprivation, England and Wales: Census 2021 article.
Figure 1: Age-specific percentages of disability by age group and sex, England 2021
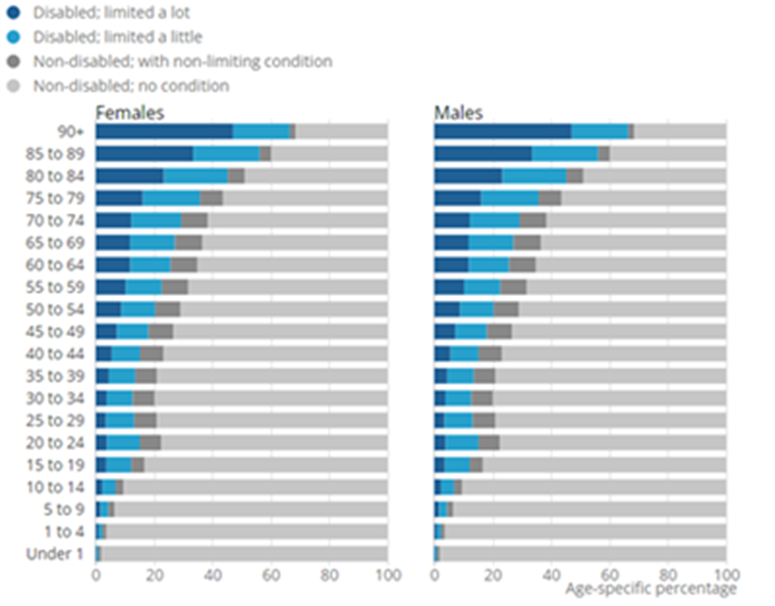
Source: Office for National Statistics For a more accessible version, please visit our accessibility policy.
Figure 2: Age-specific percentages by age group and sex, Wales 2021
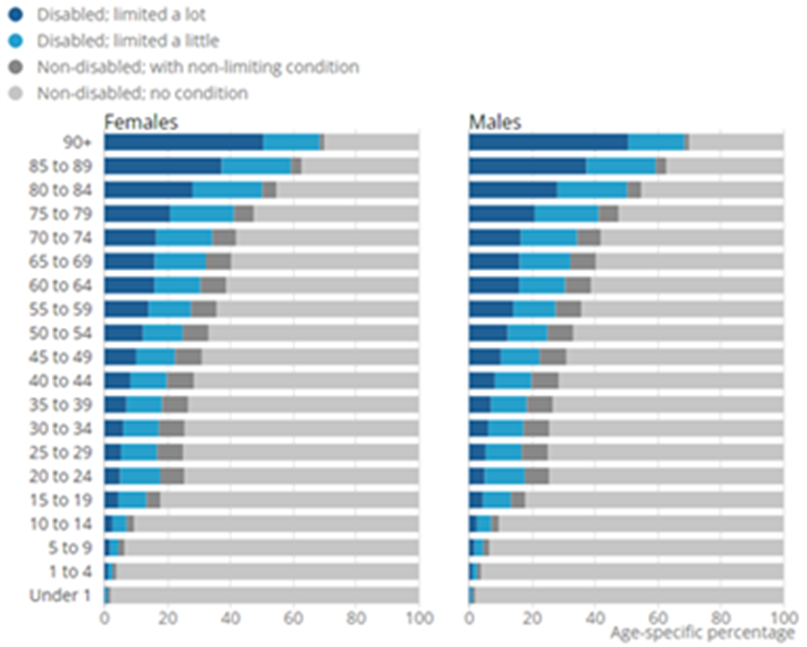
Source: Office for National Statistics For a more accessible version, please visit our accessibility policy.
Analysis on older people living in care homes is explored in our ‘Older people living in care homes in 2021 and changes since 2011’ article, with particular focus on the 65+ age group. Of the care home population aged 65 years and over in 2021 in England and Wales, 89.3% were disabled.
Unpaid care
In 2021, just over 1 in 10 people aged 65 years and above (almost 1.2 million) in England and Wales were unpaid carers.
Higher percentages of women aged 65 to 74 years were unpaid carers than men. Around the same percentage of women and men were providing unpaid care at ages 75 to 79 years. At 80 years and over, a higher percentage of men than women were carers. For more information, see our Unpaid care by age, sex and deprivation, England and Wales: Census 2021 article.
Figure 3: Percentage of population aged 65 years and over providing unpaid care, by hours, by five-year age
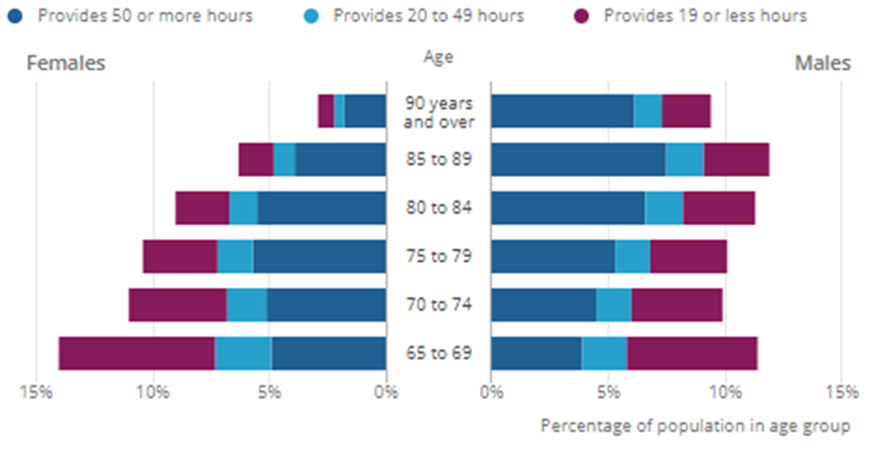
Source: Census 2021 from Office for National Statistics For a more accessible version, please visit our accessibility policy.
Age and sex by sexual orientation
In 2021, the proportion of people aged 65 to 74 years identifying as LGB+ was slightly less than 1 in 100 (0.84%). This decreased to 0.37% for those aged 75 years and over. Males were more likely to identify as LGB+ in these age groups. Of males aged 65 to 74 years, 1.15% identified as LGB+ compared with 0.55% of females. This decreased for both males and females aged 75 years and over as 0.19% of females identified as LGB+ compared with 0.60% of males.
The proportion of people in the aged 55 to 64 years age group who identified as LGB+ was 1.98% for males and 1.21% for female. Therefore, the proportion of people aged 65 years and over who identify as LGB+ is expected to increase over the next decade.
The age-sex breakdown of people identifying as LGB+ can be found in our article Sexual orientation: age and sex, England and Wales: Census 2021 and more specific age breakdowns of the older population in our Profile of the older population living in England and Wales in 2021 and changes since 2011 article. Changes between 2011 and 2021 cannot be compared as a question on sexual orientation was not asked in 2011.
Higher proportions of disabled people were LGB+ than the general population. For further information see our article Protected characteristics by disability status, England and Wales: Census 2021.
Age and sex by ethnicity
More than 9 in 10 of the population aged 65 years and over identified under the high-level “White” ethnic group on the 2021 Census (93.6%).
However, the older population has become more ethnically diverse since 2011. The percentage of the population aged 65 years and over who identified under the high-level “White” ethnic group on the 2011 Census was 95.5%.
From Census 2021 data we can see that ethnic diversity reduces with age. The proportion of people who identified under the high-level “White” ethnic group was:
- 7% of people aged 65 to 74 years
- 4% of people aged 75 to 84 years
- 2% of people aged 85 years and over
Looking at those aged 65 years and over by a 20-category ethnic grouping, on Census 2021:
- 1% identified as “White: English, Welsh, Scottish, Northern Irish or British”
- 9% as “White: Other White” (this means other than “White: English, Welsh Scottish, Northern Irish or British”, “White: Irish”, “White: Gypsy or Irish Traveller” and “White: Roma”)
- 8% as “Asian, Asian British or Asian Welsh: Indian”
- 5% as “White: Irish”
- 8% as “Black, Black British, Black Welsh, Caribbean or African: Caribbean”
- 8% as “Asian, Asian British or Asian Welsh: Pakistani”
Percentages for the rest of the ethnic groups can be found on the ONS’ create a custom dataset tool.
Considering the split between males and female for the older population across the 20-category ethnic group breakdown, there were slightly more males than females for those aged 65 years and over who identified as “White Roma” (50.5% males, 49.5% females). Furthermore, for those who identified as “Other ethnic group: Arab” the skew towards males was stronger: 60.1% males, 39.9% females.
For all other ethnic groups there were more females than males in the 65 years and over age group. This ranged from 51.0% females for those who identified as “Asian, Asian British or Asian Welsh: Pakistani” to 60.7% females for those who identified as “White: Other”.
The ONS have produced statistics on age group breakdowns by ethnic group at older ages in our article Profile of the older population living in England and Wales in 2021 and changes since 2011. More detailed analysis of the population by age, sex and ethnic group can be found in our article Ethnic group by age and sex, England and Wales: Census 2021.
For information on how disability varies by ethnic group, see our article Protected characteristics by disability status, England and Wales: Census 2021.
Age and sex by religion
The majority (72.2%) of people aged 65 years or over in England and Wales identified as Christian on the 2021 Census. The likelihood increased across older age groups:
- 4% of people aged 64 to 74 years
- 1% of people aged 75 to 84 years
- 4% of people aged 85 years and over
In comparison with the 2011 Census, the religious profile of the older population has become more diverse. The percentage of those aged 65 years and older who identified as Christian decreased from 80.4% in 2011 to 72.2% in 2021. The percentage reporting no religion and all other religions has increased, except for the percentage reporting “Jewish”, which has stayed the same.
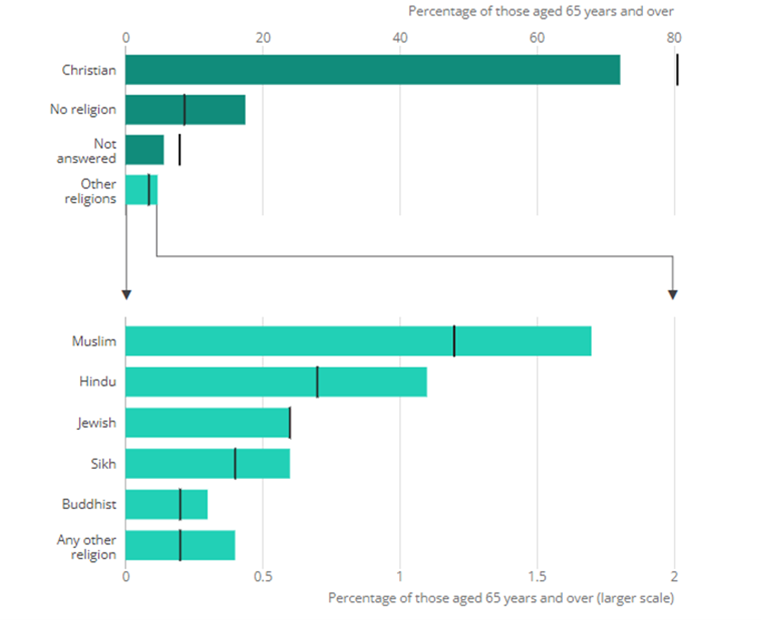
Source: Census 2021 from Office for National Statistics For a more accessible version, please visit our accessibility policy.
The largest change has been in the percentage of the older population who reported no religion. This increased from 8.5% in 2011 to 17.5% in 2021, with men aged 65 years and over more likely to report no religion (21.9%) than women in this age group (13.8%).
The ONS have produced statistics on age group breakdowns by religious affiliation at older ages in our article Profile of the older population living in England and Wales in 2021 and changes since 2011. More detailed analysis of the population by age, sex and religion can be found in our article Religion by age and sex, England and Wales: Census 2021.
For information on how disability varies by religious group, see our article Protected characteristics by disability status, England and Wales: Census 2021.
Age and sex by marriage and civil partnership status and living arrangements
In 2021, 58.3% of the population aged 65 years and over in England and Wales were married or in a civil partnership (including those who were separated but still legally married or in a civil partnership). This compares with 46.9% of the population aged 16 and over as a whole. Analysis of legal partnership status of people aged 65 and over is available here.
Same-sex marriages and all civil partnerships accounted for less than 0.3% of legal partnerships of people aged 65 and over:
Of people aged 65 years and over, 12.2% were divorced (or in a dissolved civil partnership), 23.1% were widowed (or a surviving partner from a civil partnership) and 6.3% were had never been married or in a civil partnership.
Nearly a quarter (23.1%) of people aged 65 years and over were widowed (or a surviving partner from a civil partnership), a higher proportion of women were widowed. The proportion of older people who were widowed fell between 2011 and 2021, with larger decreases for women than men as the gap between life expectancy of males and females decreases.
Women were more likely to be widowed than men, with the difference increasing across older age groups. Women were also more likely to be divorced than men.
This article explains the trends in marriage and civil partnership status between 1991 and 2021 broken down by age and sex[2].
Compared with 2011, the percentages of men and women who were widowed in 2021 were lower across all older age groups, with larger decreases for women than men as the gap between life expectancy of males and females decreases. Remarriage rates at older ages have also increased since 2011.
The proportion of people who have never been married or in a civil partnership is increasing across all age groups under 70. Therefore, the proportion of older people who have never been married is expected to increase as marriage rates fall. The proportion of people between 50 and 65 who have never been married is increasing.
Cohabitation is becoming more common at older ages. People living in a couple and cohabiting at the age of 50 to 54 increased from 13.9% in 2011 to 19.4% in 2021. For 55- to 59-year-olds, this rate increased from 10.5% in 2011 to 16.4% in 2021. For 60- to 64-year-olds, the rate increased from 7.6% in 2011 to 12.5% in 2021. Read more about living arrangements in our article People’s living arrangements in England and Wales: Census 2021.
Disability and marriage and civil partnership status
A third of disabled adults were married in 2021 (34.2% in England and 34.1% in Wales) compared with just under half of non-disabled people (47.1% in England and 45.1% in Wales); the percentage of disabled people who had never married, separated, been widowed or divorced was higher compared with non-disabled people.
The difference between disabled and non-disabled people who reported being married was greatest for those aged between 50 and 64 years. In England, 45.8% of disabled people were married, compared with 63.0% of non-disabled people. In Wales, these figures were 47.3% and 63.5% respectively.
A higher percentage of disabled people than non-disabled people were widowed at all ages. Around a quarter of the overall population aged 65 years and over were widowed[1]. The difference in widower status between disabled and non-disabled people was greatest for ages 85 years and over, where widower status was at its highest.
Consultation on the future of population and migration statistics
The ONS recently held a public consultation on our ambitious plans for transforming population and migration statistics to create a sustainable system for producing essential, up-to-date statistics on the population. High-quality, timely population statistics are essential to ensure people get the services and support they need within communities and nationwide. We have consulted to ensure that the population and migration statistics and analysis we produce continue to meet the changing needs of policy makers, citizens, and other data users.
The public consultation closed on 26 October. We would be happy to update the Committee when we publish our findings.
Labour Market Participation:
Labour market participation among older age groups has received significant attention since the onset of the coronavirus pandemic. The years leading up to the pandemic had been characterised by declining rates of economic activity across the population as a whole, including those aged over 50.
The economic inactivity rate for those aged 50-64 reached a low of 25.2% in December 2019 to February 2020. Since the pandemic however, the inactivity rate for those aged 50-64 has trended upwards, peaking at 27.7% in May to July 2022, and remaining elevated at 26.7% in the latest data. By June to August 2023, the number of inactive people aged 50-64 was 270,000 higher than in December 2019 to February 2020.
The Over 50s Lifestyle Study
The Over 50s Lifestyle Study was set up as a rapid response to the rise in economic inactivity for adults aged 50 and over since the start of the COVID-19 pandemic.
The survey was carried out for two waves: wave 1 between 8 to 13 February 2022. It covered adults in Great Britain aged 50-70 who had previously told us they were inactive in the Opinions and Lifestyle Survey in 2021. Wave 1 achieved a sample of 13,803. Wave 2 asked adults in Great Britain aged 50-65 (up to working age population) between 10 to 29 August 2022 achieving a sample size of 23,490.
Wave 1 and 2 focused on understanding the reasons and motivations for leaving work for those who became inactive. Wave 2 also included those who were still active at the time of data collection to understand what motivated them to remain in work. Factors such as support in the workplace, health, skills and job appeal were identified as possible reasons for work retention among adults aged 50 and above. These factors are discussed in greater detail below.
Access to support
Access to support may be a factor in retaining the workforce. Those who have never left the workforce were more likely to say they have access to support from their employer (all categories excluding flexible working) than those who left work (either before or after the pandemic) and have returned to work.
The majority (95%) of people working within the Civil Service and local government reported access to support with high proportions of people gaining access to; flexible working (80%), occupational health (71%) and reasonable adjustments for health and wellbeing (70%).
While over half (51%) of adults working in Personal Services (e.g., hairdressers or tattooists) reported none of the above in terms of access to support, followed by those working in Hospitality (48%) and Arts, Entertainment and Recreation (46%).
Health
Mental health and disability were more common reasons for not returning to work for the younger aged group. Those who had left work since the pandemic and had not returned were more likely to have a physical or mental health condition or illness (51%) than those that left since the pandemic and returned to work (43%).
Just under one in five (18%) of those who had left work since the pandemic and had not returned said they were currently on an NHS waiting list for medical treatment. Similar proportions were reported for men (17%) and women (19%), and across age bands (18% for 50-to-54 years, 19% for 55-to-59 years and 16% for 60-to-65 years). Among those who left their previous job due to a health-related condition (stress, mental health, illness, or disability), the proportion on an NHS waiting list increased to 35%.
Skills
Those in their early 50s were generally more likely to want to upskill than any other age group. Around 8 in 10 (82%) adults who left work since the pandemic, and had not returned, felt that they had the right skills to get a new job. This compared with 74% of all adults aged 50 to 65%.
Among those who left since the pandemic, had not returned but would consider working in future, the majority (59%) said that they would not like to improve on any of the suggested training. 15% of all adults said they would like to improve on their advanced IT skills.
Job Appeal
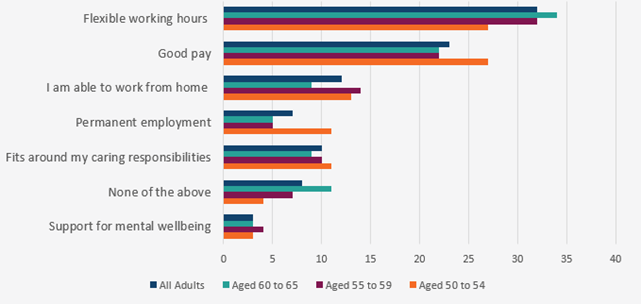
Working flexibly was reported to be an important consideration when looking for work. Among adults aged 50-to-65 who have left their job since the start of the pandemic and would consider returning to work (58%), the most important factors when choosing a paid job were; flexible working hours (32%), good pay (23%), and being able to work from home (12%).
More people appeared to be taking up flexible working when returning to work, which may be due to there being more flexible working options available since the pandemic. Among those who left work since the pandemic and had returned, 11% had accessed flexible working in their previous job compared to 29% when returning to the workforce.
Figure 5: Most important factors when choosing a paid job by age-group, Great Britain, 10 to 29 August 2022[1],
Source: Office for National Statistics For a more accessible version, please visit our accessibility policy.
We hope this submission is useful for the Committee’s inquiry. Please let us know if we can provide anything further.
Yours sincerely,
Professor Sir Ian Diamond
[1] Notes: 1. Base: Adults aged 50 to 65 years who have left their job since the start of the coronavirus pandemic (March 2020) and have not returned 2. Respondents were able to choose more than one option. 3. The chart includes the most popular response options. Other response options were included in the survey.