Dear Mr Brine,
I write in response to the Health and Social Care Committee’s call for evidence for the inquiry into Men’s Health.
As the Committee will be aware, the Office for National Statistics (ONS) is the UK’s National Statistical Institute and largest producer of official statistics. We aim to provide a firm evidence base for sound decisions and develop the role of official statistics in democratic debate. We produce a wide range of health publications, including official statistics on life expectancy, mortality, and mental health. Insights from these statistics may be of interest to the Committee as your inquiry progresses.
To develop our analytical priorities, we work with a range of stakeholders, including Government departments, academics and charities. For instance, for the work around suicide, we work with the National Suicide Prevention Strategy Advisory Group, chaired by Professor Louis Appleby with membership spanning government departments and a wide range of charities. Additionally, we engage with the Department of Health and Social Care to ensure our analyses are timely and policy-relevant, and with the Ministry of Justice and Office for Veterans’ Affairs on suicides among prisoners and armed forces veterans respectively.
What factors drive lower, and falling, male life expectancy and what action would have the biggest impact on addressing this?
Fall in life expectancy
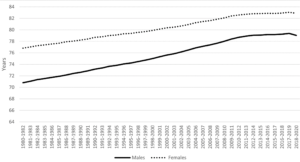
Over the last 40 years life expectancy in the UK has been increasing, albeit at a slower pace in the last decade (see Figure 1). This increase has been primarily because of a reduction in mortality at older ages driven by advances in health care, and improvements in living and working conditions.
Our most recent publications show a slight decrease in the estimated life expectancy of males across the UK. Decreases have been reported at national level and at local levels. This was driven by the coronavirus pandemic which led to a greater number of deaths than normal in 2020.
Generally, the decreases reported in life expectancy at a local level are seen in areas where rates of deaths due to any cause were the highest. The first peak in coronavirus deaths was in April 2020, while the country was in the middle of the first national lockdown. At this time, urban centres in London, Birmingham, the north of England and South Wales had the highest rates of deaths due to any cause.
When producing the national life tables, we average mortality observed over three years to smooth out the impact of exceptional events, such as a flu epidemic, on reported life expectancy. Despite this smoothing, the excess mortality observed in 2020 led to estimates of life expectancy at birth for males for 2018 to 2020 falling to levels reported for 2012 to 2014. Female estimates of life expectancy were virtually unchanged from 2015 to 2017. The difference in trends for males and females reflects the larger increase in male mortality rates in 2020.
The slight decreases in life expectancy reported do not necessarily mean that a male born in 2018 to 2020 will go on to live a shorter life. This is because the reported life expectancies assume that the higher-than-average mortality observed in 2018 to 2020 will continue. It is possible that life expectancy will return to an improving trend in the future.
The latest national life expectancy estimates are provisionally scheduled to be released in November 2023. These estimates will cover the period 2020 to 2022.
Figure 1: Life expectancy at birth for males and females, UK, between 1980 to 1982 and 2018 to 2020

Source: Office for National Statistics- – National life tables – life expectancy in the UK: 2018 to 2020 For a more accessible version, please visit our accessibility policy.
Difference between males and females
As Figure 1 shows, despite improvements in life expectancy over the last 40 years there is a remaining difference between males and females. In the latest period, 2018 to 2020, life expectancy at birth in the UK was 79.0 years for males and 82.9 years for females. However, over the past 40 years the gap has steadily narrowed; from 6.0 years in 1980-82 (Male: 70.8, Female: 76.8) to 3.8 years in 2018-20 (Male: 79.0, Female: 82.9). Differences are also reporting with varying gaps when looking at lower geographical areas within the UK.
The difference in life expectancy between males and females is seen across the world, as highlighted by the Organisation for Economic Co-operation and Development (OECD). In the latest update, the UK had one of the narrowest gender gaps in life expectancy across OECD countries.
While a general trend of females having a longer life expectancy than males has persisted, it is important to note that ONS analysis based on ONS Longitudinal Study data has shown that socio-economically advantaged males in 21st Century are living significantly longer than disadvantaged females, something that wasn’t the case in the 1980’s or 1990’s. This is driven by a much greater increase in male life expectancy amongst advantaged men (categorised under the “Higher Managerial” and “Professional” classes) over the previous 40 years, with the Slope Index of Inequality showing the gap in life expectancy at birth for males widening from 5.6 years in 1980 to 6.4 years in 2016.
A sizable contribution to the lower life expectancy observed in men is made by a higher rate of avoidable deaths. This refers to deaths that are preventable or treatable, including neoplasms (cancers), which represent the largest driving cause of avoidable mortality.
In 2019, avoidable deaths were 59.0% higher among males than females, this gap has narrowed since 2001 when it was 75.0%. Deaths involving alcohol-related and drug-related disorders are the only category of causes where the age-standardised mortality rate (ASMR) has statistically significantly increased since 2001.
Avoidable mortality can also be split up into preventable mortality, which are deaths that can be avoided through health interventions before the onset of diseases or injuries (to reduce incidence) and treatable mortality, which are deaths that can be avoided through healthcare interventions after the onset of disease, to reduce case-fatality. In 2019, preventable deaths were 89.0% higher in males than females, but this too was lower than in 2001 when the gap was 110% higher, while treatable mortality was 19.0% higher in 2019, a fall from 32.0% in 2001.
The ONS conducts specific analysis on drug poisoning deaths in England and Wales. Males accounted for more than two-thirds of registered drug poisonings in 2021 (3,275 male deaths compared with 1,584 female deaths), which is consistent with previous years. The male rate of drug misuse deaths was 77.5 deaths per million in 2021 (2,206 registered deaths) and the female rate was 29.3 deaths per million (854 deaths).
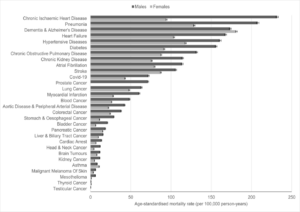
The most recent analysis from the ONS on inequalities in mortality involving common physical health conditions in England found that the age-standardised rate of all-cause mortality (per 100,000 person-years) was 1.3 times higher for males than females during the period 21 March 2021 to 31 January 2023. Males also had higher age-standardised rates of mortality for most individual conditions examined (Figure 2). In absolute terms, the biggest differences were observed for chronic ischaemic heart disease (232.0 for males, 94.5 for females), pneumonia (207.8 for males, 129.0 for females), diabetes (156.1 for males, 91.5 for females), and heart failure (167.9 for males, 103.8 for females).
Figure 2: Age-standardised mortality rates (per 100,000 person-years) and 95% confidence intervals for deaths involving common physical health conditions by sex, England: 21 March 2021 to 31 January 2023

Source: Office for National Statistics – Inequalities in mortality involving common physical health conditions, England: 21 March 2021 to 31 January 2023 For a more accessible version, please visit our accessibility policy.
What is driving higher rates of suicide amongst men and how could this be addressed?
As seen since the mid-1990s, males accounted for three-quarters of suicide deaths registered in England and Wales in 2021. Suicide appears in the top five common causes for men under the age of 50, where health conditions related to ageing are less prevalent than those in older age groups. When looking at age-specific suicide rates by broad age groups men aged 45 to 64 have had the highest age-specific suicide rates since 2010. Males aged 10 to 24 years have had the lowest rates since 1981. In 2021, the rate in this group was 8.0 deaths per 100,000.
Male rates for all age groups were higher in 2021 than in 2020, except for those aged 75 years and over where the rate remained unchanged. We saw a significant increase in the rate of deaths registered as suicide in 2021. This increase was the result of a lower number of suicides registered in 2020, because of the disruption to coroners’ inquests caused by the coronavirus pandemic. The 2021 suicide rate was similar to the pre-coronavirus pandemic rates in 2018 and 2019. The latest available evidence shows that suicide rates did not increase because of the coronavirus pandemic, which is contrary to some speculation at the time.
Our Sociodemographic inequalities in suicides in England and Wales: 2011 to 2021 publication also highlighted differences between males and females. Further, it showed that for men aged 40 to 50 years, the highest rates of suicide were in disabled people, those who have never worked or are in long-term unemployment or are single (never been married or in a civil partnership). For ethnicity, rates of suicide were highest in the White and Mixed/Multiple ethnic groups for both men and women. People who reported belonging to any religious group had lower rates of suicide, compared with those who reported no religion; however, rates were higher in Buddhists and “Other” religious groups.
We have also looked at the risk of suicide and drug-related deaths among prisoners, based on confidential matching of data from HM Prison and Probation Service and Office for National Statistics mortality records. Male prisoners were at an increased risk of dying by suicide compared with the general male population; the risk of male prisoners dying by suicide was 3.9 times higher than the general male population between 2008 and 2019.
There will be a range of factors to consider when tackling suicide rates. The Committee will be considering access to services that may help those at risk of suicide. The ONS have produced analysis on access to health care, looking at the socio-demographic differences in use of Improving Access to Psychological Therapies (IAPT) services. It showed men with a probable common mental disorder were less likely to access IAPT services than women.
We have also conducted analysis on prevention of future death (PFD) reports for suicide. Coroners have a duty to issue a PFD any person or organisation where, in the opinion of the coroner, action should be taken to prevent future deaths. A total of 164 PFD reports were available. For context, around 5,000 suicides are registered in England and Wales each year. As such, PFD reports are only issued for a small number of cases. The NHS (including health boards, trusts, clinical commissioning groups, primary care services, health and care partnerships and ambulance services) were the most frequent recipient of PFD reports, having received 42.0% of all reports. Of the 164 reports, around 62.0% of the deceased were male, 37.0% were female. The analysis highlights the range of concerns raised by coroners following a suicide, including processes not being followed, and inadequate documentation and monitoring, which may have prevented a death. We hope this analysis will provide valuable insight for those concerned with suicide prevention.
Please let us know if you would like to discuss any of this further.
Yours sincerely,
Emma Rourke
