Dear Mr Jones,
I write in response to the Business, Energy and Industrial Strategy Committee’s call for evidence for its inquiry, ‘post-pandemic economic growth: UK labour markets’.
As the Committee will be aware, the Office for National Statistics (ONS) is the UK’s National Statistical Institute and largest producer of official statistics. This inquiry is of particular interest and relevance to us as we are responsible for producing employment and labour market statistics and analysis for the UK.
We have focussed our written evidence submission on our most recent statistical analysis of skills in the current labour market, which are most and least prevalent, and how this has changed because of the coronavirus pandemic. We have also provided analysis of changes in employment contracts and working patterns, and of the impact of an ageing population of the labour market and sectoral productivity.
I hope this is useful, and I look forward to discussing this with the Committee in person on 19 July.
Yours sincerely,
Mike Keoghan
Deputy National Statistician for Economic, Social and Environmental Statistics
Office for National Statistics written evidence ‘post-pandemic economic growth: UK labour markets’, July 2022
Executive Summary
- Changes in the labour market due to the coronavirus (COVID-19) pandemic have had significant effects on different industry sectors.
- Overall, lower-skilled, and lower-paid occupations saw falls in employment from September 2016 to September 2021. Comparatively, higher-paid, and higher-skilled occupations saw an increase in employment during this same time period. Additionally, the number of people whose highest qualification was an undergraduate degree or equivalent grew by 7.5% to 9.4 million over the same period.
- In June 2022, 15% of businesses reported they were experiencing a shortage of workers, and for businesses with 250 or more employees, the percentage that reported worker shortages was 43%.
- The number of full-time employees continued an upward trend during the pandemic and is at a record high in the latest period. The number of part-time employees has also increased over the last year. This follows significant falls early on during pandemic. Self-employment also remains low following large falls during the early stages of the pandemic.
- 2022 saw the proportion of workers working in a hybrid model rising; 84% of workers who had to work from home planned to carry out a combination of home working and working from their place of employment. Almost a quarter of businesses reported using or intending to include homeworking as a permanent business model, although this differs by industry.
- Economic inactivity has increased by 522,000 persons in October to December 2021 compared with the period October to December 2019. Most of the increase was because of those aged 50 years and over, contributing 94.4% (493,000) to the overall change. The rise in inactivity rates among older workers appears to be more prevalent in Professional Occupations.
The state of play in the UK labour market post EU Exit and the impact of the COVID-19 pandemic on recruitment, skills shortages, and the growth of the labour market
Do we have enough workers with the right skills in the right places?
- Through our overview of human capital estimates in the UK, we can see there has been a steady rise in people with higher qualifications. In 2020, the number of working age people with a master’s or PhD qualification grew by 10.9% to 5.1 million when compared with 2019. Similarly, the number of people whose highest qualification was an undergraduate degree or equivalent grew by 7.5% to 9.4 million over the same period. We aim to publish regional estimates of these by the end of July 2022.
- Looking at those in employment, from our NOMIS database, there is large variation in workers with different skills. At one extreme of the skill levels distribution, Harrow, Newcastle-under-Lyme, and Torridge had the highest proportion of people in employment with the lowest skill level in 2021, at around one in five in jobs like cleaners and catering assistants. At the other end of the skills distribution for the same period, about one in two people in employment in Camden, East Renfrewshire and Elmbridge were in the highest skill-level occupations such as science and technology professionals. The ONS will be publishing more of this information at varying geographic levels, as well as how it has changed over time since 2004, by mid-July 2022, and will send to the Committee when released.
- To identify whether workers have the right skills, we look at labour demand indicators. In our recent release, Labour Demand Indicators by Local Authority, we identified changing demands that varied by region and urban/rural classification. For example, the North East saw the biggest increase in online job adverts, particularly for the local authorities of Newcastle upon Tyne and County Durham.
- We will be investigating the differences in labour demand by occupation in an upcoming release in summer 2022, to understand what type of skills are being sought. This is part of wider work the ONS is developing to identify skills demand specifically and compare it with modelled estimates of existing skills of the workforce (deriving ‘skills stocks’) as well as the skills of the ‘potential’ workforce who are looking for a new job, to see if there are specific skills shortages in specific areas, or if demand can be met with existing potential workers. This work should be delivered iteratively up to March 2023.
Which sectors are experiencing the most acute shortages of workers since the pandemic?
- Estimates from the Business Insights and Conditions Survey (BICS) show that in early June 2022, 15% of businesses reported that they were experiencing a shortage of workers, up from a low of 13% reported in early May 2022. However, for businesses with 250 or more employees, the percentage that reported worker shortages in early June 2022 was 43%.
- In early June, the accommodation and food service activities industry continued to report the largest percentage of businesses experiencing worker shortages, at 35%, followed by the construction industry at 25%.
- In the Accommodation and food service industry, 65% of businesses reporting worker shortages said that ‘employees working increased hours’ in early June, while 30% ‘had to recruit temporary workers’ or were ‘unable to meet demands’. In construction, 54% of businesses reporting shortages of workers reported that they were ‘unable to meet demands’ in early June, while 23% reported ‘employees working increased hours’.
- Since March 2022, approximately 1 in 10 businesses report to have experienced difficulties in recruiting employees, rising to more than 4 in 10 among larger firms (with 50 or more employees). Accommodation and food service activities (24%), Human health and social work activities (23%), and Real estate activities (17%) had the highest percentage of businesses reporting difficulties in recruiting employees in May 2022.
- In March 2022, across all businesses not permanently stopped trading and had difficulty recruiting employees, 50% reported they had difficulty recruiting skilled, manual or technical employees, followed by 40% reporting difficulties in recruiting semi-skilled or unskilled employees. Low number of applications for the roles on offer and lack of qualified applicants for the roles on offer were the most common reasons given (approximately, 6 in 10) for experiencing difficulties in recruiting employees.
What impact has the UK’s departure from the EU had on the flow of workers into and out of the UK? Are there particular sectors or skill sets that are most impacted?
- The fall in employment seen since 2016 have been largely driven by UK nationals as shown in the Changing Trends and Recent Shortages in the Labour Market publication[2]. In the 12 months to September 2020, the number of EU workers increased by 119,000 workers when compared with the same period in 2016. The year change from October to September 2020 to October to September 2021 saw a fall of 91,000 EU workers, suggesting a possible pandemic effect.
- Payrolled employment counts from HMRC showed the same signal of a fall in EU workers, indeed, the magnitude was higher using this measure, though comparing a longer time period. Between June 2019 and June 2021, payrolled employments held by EU nationals fell by 6% (171,100). This was offset by those of non-EU nationals, which increased by 9% (186,300) in the same period. The largest decline in total payrolled employments was seen in accommodation and food services; this was driven by a 25% (98,400) fall in payrolled employments of EU nationals during the two years up to June 2021.
- Overall, net international migration has seen a considerable change in the proportion of EU and non-EU since the EU referendum in 2016, where after 4 years of year on year increases, net EU migration began to fall. This was more than offset by non-EU migration which gradually increased to some of the highest levels on record up to the point of the pandemic. Most recent estimates show year to June 2021 EU migration was near zero while non-EU migration was 251,000.
To what extent is long covid contributing to economic inactivity due to long-term levels of sickness absence and early retirement?
- The ONS is currently working on an analysis of the association between SARS-CoV-2 infection / long COVID and changes in employment status (working or not working) using data from the Coronavirus Infection Survey. However, it is not possible to identify long-term sickness absence from the survey data. We anticipate being able to publish results from this work later this year and will share these with the Committee.
- A longer-term project involves linking population-level census and SARS-CoV-2 testing data to the Department for Work and Pensions and HMRC administrative records to infer the relationship between SARS-CoV-2 infection and subsequent changes in labour market outcomes, such as employment status, income, and benefit claims (for example, state pension, incapacity benefit and jobseekers’ allowance). This project is currently in the planning stages, and we anticipate being able to publish initial findings in early 2023.
Employment status and modern working practices five years on from the Taylor Review
How are working patterns changing in the UK? To what extent is the gig economy growing and permanent full-time employment contracts in decline?
- While the ONS does not publish any statistics on permanent full-time employment contracts directly, we do publish estimates of temporary employees and full-time/part-time employees in dataset EMP01, with further information about temporary employees in dataset EMP07. The following paragraphs are based on the estimates published in those two datasets.
- Prior to the COVID-19 pandemic, the number of temporary employees had been largely decreasing since late 2014. The number then began to increase in late 2019. Initially as the pandemic took hold the number decreased, before rapidly increasing from the second half 2020. By October to December 2021, the number of temporary employees was at its highest level since late 2014. The number has been relatively flat since, remaining at historically high levels but below the record highs seen in 1997.
- The increase in temporary employees during the COVID-19 pandemic, from July to September 2020, was largely driven by women. Initially, the increase was driven by employees who were in temporary work because they could not find a permanent job. However, the number of people in this group has been largely decreasing since April to June 2021. It has been those in temporary work because they did not want a permanent job who have largely driven the increase since early 2021. This indicates that, during the later stages of the COVID-19 pandemic, an increasing number of people in temporary work were in their desired form of employment.
- In the Labour Force Survey (LFS), temporary employees include those on fixed period contracts, agency temps and those in casual or seasonal work. Those on fixed period contracts comprise the largest proportion of temporary employees – 44% in January to March 2022 – and it was this group that largely drove the increase during the COVID-19 pandemic.
- Looking at both permanent and temporary employees, the number of full-time employees continued its upward trend during the pandemic and is at a record high in the latest period. The number of part-time employees has also increased over the last year following large falls early in the COVID-19 pandemic, although numbers remain well below pre-pandemic levels. Self-employment also remains low following large falls during the early stages of the pandemic. These were largely driven by people flowing from self-employed to employee status, and by people reclassifying their self-reported labour market status in this way while remaining in the same job.
- While the proportion of temporary employees increased from mid-2020 and has levelled off at around 6% in recent periods, this is below the proportions reached during the 1990s and in the years following the 2008/09 financial crisis. Therefore, despite increases in those in temporary employment during the pandemic, the number of employees in permanent employment remain high.
How have employee demands and employer offers of flexible working been affected by the pandemic?
- Prior to the COVID-19 pandemic, the proportion of people working from home had been steadily increasing. The Annual Population Survey found that between 2011 and 2019, the proportion of people who did any work at home increased from 23.9% to 26.6%. This trend accelerated during the pandemic with 35.9% of people reporting doing at least some work at home in 2020.
- More recent data from the Opinions and Lifestyle Survey show that during 2022, the proportion of workers both working at home and at their usual place of work (“hybrid working”) has been rising. When asked about future intentions in February 2022, 84% of workers who had to work from home because of the COVID-19 pandemic said they planned to carry out a mix of working at home and in their place of work in the future.
- Of those who reported working from home, more than three-quarters (78%) said that being able to work from home gave them an improved work life balance in February 2022. Half reported it was quicker to complete work (52%) and that they had fewer distractions (53%). Almost half also reported improved well-being (47%).
- In the Business Insights and Conditions Survey, almost a quarter of businesses (23%) reported using or intending to include homeworking as a permanent business model in April 2022, an increase from 16% when businesses were asked in autumn 2020.
- This differs by industry: more than half (54%) of businesses in the information and communication industry reporting they were using, or intended to use, increased homeworking as part of a permanent business model in early April 2022. This was only the case for 3% of businesses in the accommodation and food services industry, and 5% of businesses in the construction industry, which are less adaptable to homeworking.
- Among business who reported using or intending to use homeworking as part of a permanent business model, the most common reason for doing so was improved staff well-being (60%), followed by reduced overheads (43%) and increased productivity (41%).
The impact of an ageing population on the labour market
What impact is the ageing population already having on employment rates and labour productivity?
- Overall economic inactivity has increased by 522,000 persons in October to December 2021 compared with before the pandemic (October to December 2019). Most of the increase was because of those aged 50 years and over, contributing 94.4% (493,000) to the overall change.
Figure 1: Volume change of economically inactive people since October to December 2019, by age bands, UK, October to December 2019 to October to December 2021, seasonally adjusted
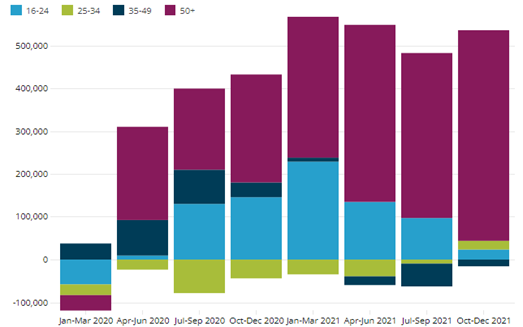
Source: Office for National Statistics – Labour Force Survey For a more accessible version, please visit our accessibility policy.
Source: Office for National Statistics – Labour Force Survey
- As reported in our overview of human capital estimates in the UK release, the ageing population has decreased human capital stock grown since 2004. Since 2016, ageing has had a larger negative effect on human capital stocks growth, with stocks growing by 0.5 percentage points less each year on average due to the ageing population.
Figure 2: Contribution to change in real full human capital stock (%)
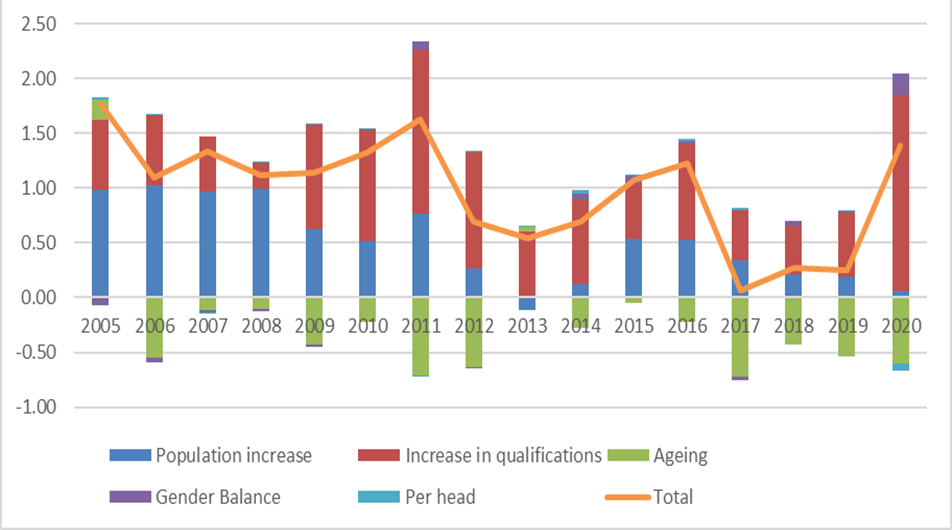
Office for National Statistics – Annual Population Survey, Longitudinal Labour Force Survey and ONS National Life Tables For a more accessible version, please visit our accessibility policy.
Source: Office for National Statistics – Annual Population Survey, Longitudinal Labour Force Survey and ONS National Life Tables
How is the UK’s ageing population exacerbating the labour shortage that can already be felt in some sectors, e.g., hospitality, hair and beauty, social care?
- The rise in inactivity rates among older workers appears to be more prevalent in Professional Occupations given that older workers are typically clustered within these higher skilled occupations. The changing trends and recent shortages in the labour market publication reports that in the 12 months to April to June 2021, 9% of workers who left their job in the last 12 months flowed into inactivity, the highest flow being Professional Occupations at 5.5%.
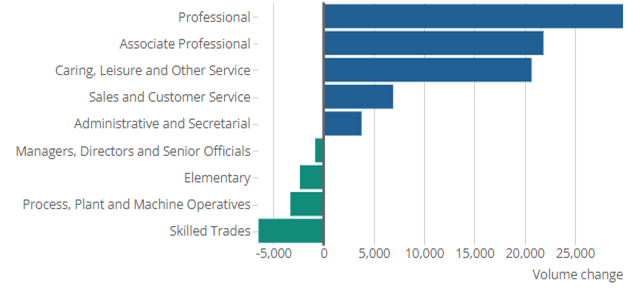
- Similarly, the movements out of work for those ages over 50 years publication found that the occupation with the largest number of 50- to 70-year-olds, professional occupations, saw the largest volume change moving to economic inactivity, an increase of around 30,000, when comparing the movements from Quarter 2 to Quarter 3 2021, with the same period in 2019.
- The second-largest occupation for workers aged 50 to 70 years, associate professional occupations, saw movements to economic inactivity increase by around 22,000, when comparing Quarter 2 to Quarter 3 2021 with the same quarters in 2019. The proportion moving to economic inactivity increased from 3.2% to 4.5%.
- Caring, leisure and other service occupations saw the largest increase in the proportion of the group moving to economic inactivity. The proportion becoming economically inactive increased from 3.0% to 6.0%, or around 21,000 workers in volume terms.
Figure 3: Total change of workers aged 50 to 70 years flowing into economic inactivity by occupation, between April to June and July to September, UK, 2021 compared with 2019
Source: Office for National Statistics – Longitudinal Labour Force Survey For a more accessible version, please visit our accessibility policy.