Dear Ms Reeves,
I write in response to the Business, Energy and Industrial Strategy Committee’s call for evidence for its inquiry Supporting Regional Investment and Growth.
As the Committee may be aware, the Office for National Statistics (ONS) is the National Statistical Institute of the UK, and the largest producer of official statistics. ONS aims to provide a firm evidence base for sound decisions and develop the role of official statistics in democratic debate.
The range of statistics and analyses published by ONS on regional and sub-regional productivity allows us to explore the differences in economic performance between different regions in the UK.
This note summarises some key findings that have emerged from analysis of existing evidence.
I hope the Committee finds this evidence to be of use. Please do not hesitate to contact me if I can be of any further assistance.
Yours sincerely,
Jonathan Athow
Deputy National Statistician and Director General, Economic Statistics
Office for National Statistics
Supporting Regional Investment and Growth
Executive Summary
1. Labour productivity is unevenly distributed across the UK, with significant differences across and within different regions. The majority of high productivity areas are in London and the South East region, while predominantly rural areas in England and Wales are among the areas with the lowest productivity levels.
2. Observed average aggregate productivity in an area can be derived from the presence of a range of industries, or differences in firm productivity within the same industry. Analyses from the past three years suggest that differences in firm-level productivity is the main determinant of regional productivity differences.
3. Spatial concentration of employees within Great Britain is seen most prominently within knowledge-intensive industries such as information and communication; and professional, scientific and technical activities. The manufacturing industry displays a more varied spatial distribution of jobs.
4. London had the highest public sector expenditure in the FYE 2018 and Northern Ireland had the lowest. However, on a per-head basis, Northern Ireland had the highest public sector spending of all regions, and the South East had the lowest.
5. Public sector revenue for the FYE 2018 on a per-head basis was highest in London and lowest in wales. London also raised the highest revenue on a population-share basis and on a geographic-share basis.
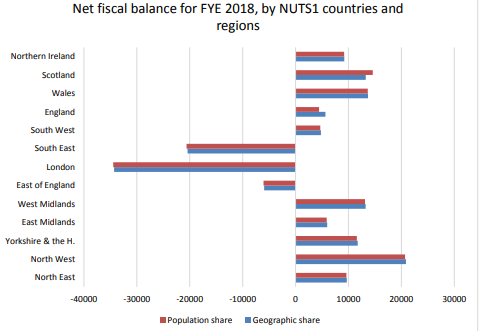
6. London and the South East region have the lowest net fiscal balance for FYE 2018, and the North West region has the highest. This is a continued trend from FYE 2016.
Regional and sub-regional productivity
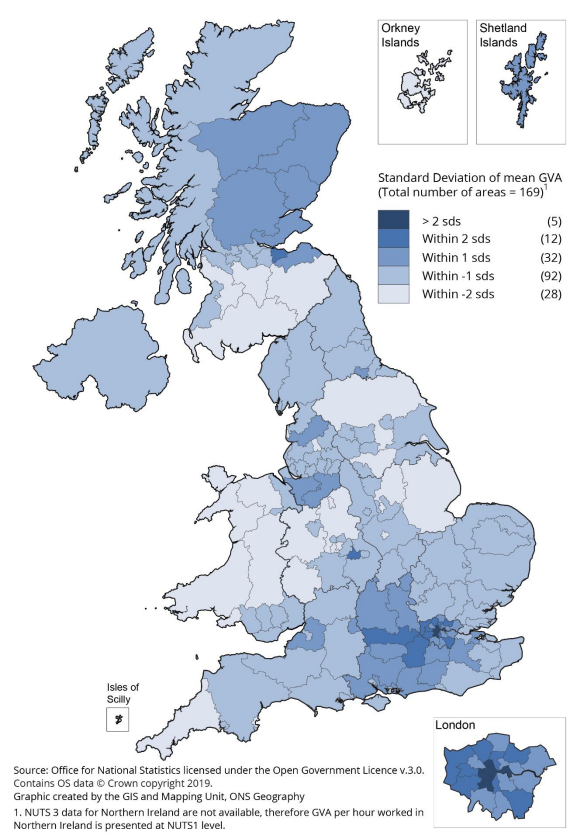
7. ONS regional and sub-regional productivity estimates show that economic performance in terms of labour productivity, which is measured as Gross Value Added (GVA) per hour worked, GVA per job or GVA per employment, is not evenly spread across the UK. There are significant differences in aggregate average labour productivity between and within different regions and countries of the UK. For example, productivity in Tower Hamlets in London is around 2.5 times higher than productivity in the rural area of Powys in Wales.
8. However, there is a skewed distribution of labour productivity across the nation. Figure 1 below shows that 15 out of 17 very high productivity areas are located either in London or west of London along the M4 corridor in the South East region, while predominantly rural areas in England and Wales were among the areas with the lowest levels of labour productivity in 2017. The data also highlight that many subregions (at Nomenclature of Territorial Units for Statistics (NUTS) 3 level) of the UK have very similar productivity levels to each other.
9. Geographical differences in labour productivity in the UK have been persistent over the last 13 years. Data show that spread in average productivity was increasing slightly as average productivity differences between the areas were widening before the financial crisis of 2007. However, after 2007, the spatial productivity differences at NUTS 3 level decreased slightly, mainly due to lower productivity growth rates in the high-productivity areas of London. Therefore, overall while productivity differences continue to exist between areas, these differences have not increased over the past decade. It is also the case that there has not been significant changes in the relative rankings of areas through the period.
Figure 1: Labour productivity (GVA per hour worked) distribution in the UK: standard deviation of the UK average GVA per hour work for NUTS 3 subregions, 2017
Drivers of regional productivity differences
10. Observed average aggregate productivity in an area derives from two main sources:
• the areas can have a different industry mix. Therefore, a relatively high aggregate productivity in a region may sometimes be a reflection of a relatively large share of more productive industries (e.g., knowledge intensive service industries or advance manufacturing) in that location.
• within the same industries, the firm productivities in one area can differ from those in the same industry in other areas.
11. Our analyses from 2017, 2018 and 2019 show that differences in firm-level productivity within industries are a bigger determinant of the geographical differences in productivity than the different industry structures of the areas. Even within single industries we can observe large differences in average productivity levels between different parts of the country, particularly in services industries. Differences in productivity within service sectors of the economy between London and other areas of the country are a particularly important source of the difference in productivity levels. For Scotland, London and the South East, their industry compositions also have some positive impact on their overall average productivity levels, however, the higher average productivity of the firms in these regions play a more significant role than their industry structures on their overall average aggregate productivity levels.
12. ONS also investigated the factors that are associated with firm-level productivity in more detail. Particularly focussing on examining and contrasting factors that are internal to firms with those that are external and associated with location. While obtaining conclusive evidence is difficult, the available evidence suggests that while there are some important internal factors influencing firm-level productivities, such as the ownership of a firm and whether it trades internationally, it is also the case that to understand the larger geographical differences, for example, between London and other areas of the UK, focus also must be placed on external geographical factors.
13. Such a focus on external factors recognises that each firm operates in its own locale with, for example, a specific mix of local product and factor markets, local infrastructure, agglomeration benefits, firm competition, consumer tastes and local spending power. These factors can affect firm-level productivities and ultimately average productivity in an area.
Planned and possible future work on productivity:
14. In response to policy interest, we aim to continue further work in this area to increase our understanding of the observed spatial labour productivity differences in the UK. In particular we would like to investigate in more detail the external location-based factors that influence spatial productivity differences.
Spatial distribution of industries
15. Within Great Britain, a spatial concentration of employees is seen particularly in some of the relatively high productivity knowledge-intensive service industries such as information and communication; and professional, scientific and technical activities (also see: The spatial distribution of industries). Employee jobs in these industries are particularly concentrated in London, South East and East of England
16. The scientific research and development sector is a particularly important sector within the professional, scientific and technical activities industry. Employee jobs in this sector are highly concentrated in Berkshire, Buckinghamshire and Oxfordshire in the South East, and East Anglia in the East of England. In both areas the share of employee jobs in scientific research and development was three and a half times greater than their share of all employee jobs in Great Britain. Concentration of employee jobs in scientific research and development can also be seen around Eastern Scotland and North Eastern Scotland, as well as Tees Valley and Durham, and North Yorkshire NUTS 2 subregions.
17. London has a low relative share of employee jobs in scientific research and development. However, it has relatively high concentrations of employee jobs in other knowledge intensive services sectors, in particular the activities of head offices, advertising and market research and financial service activities. Aside from a high concentration in central London, Eastern Scotland and West Yorkshire NUTS 2 subregions also have a relatively high share of employee jobs in the financial service activities sector.
18. The manufacturing industry has a more mixed spatial distribution of jobs. Employee jobs in manufacturing are concentrated in the East Midlands, West Midlands, Wales and in the northern
regions of England but virtually absent from London.
19. Within the manufacturing industry, employee jobs in the manufacture of motor vehicles sector are highly concentrated in the West Midlands region, which accounted for a third of all eployment in this sector nationally. In particular, Herefordshire, Worcestershire and Warwickshire NUTS 2 subregion has a relatively high concentration of employee jobs in the manufacture of motor vehicles, with four point six times its share of employment in this industry than its share of total employee jobs in Great Britain. The North East, Northumberland and Tyne and Wear NUTS2 subregions within the North East region also has a relatively high concentration of employees in the manufacture of motor vehicles.
20. The manufacture of chemicals displays a different spatial distribution to the manufacture of motor vehicles. Employee jobs in the manufacture of chemicals are mainly concentrated in the north of England, particularly in Tees Valley and Durham in the North East. Four of the five NUTS 2 areas in the North West are also among the NUTS 2 areas with the highest concentration of jobs in this sector. In the south of England, the NUTS 2 areas with relative concentrations in the manufacture of chemicals were Kent, East Anglia, and Dorset and Somerset.
Country and regional public sector finances
21. The country and regional public sector finances are published annually by ONS, aiming to provide users with information on what public sector expenditure has occurred, for the benefit of
residents or enterprises, in each country or region of the UK; and what public sector revenues have been raised in each country or region – as well as the balance between them. The country and regional public sector finances are consistent with the UK public sector finances.
22. The statistics are neither reflective of the annual devolved budget settlements nor are these data used when calculating devolved budget settlements. Furthermore, they do not provide information on the spending and revenue of individual country or regional bodies such as the Greater London Authority.
Expenditure
23. Public sector expenditure is the total capital and current expenditure (mainly wages and salaries, goods and services, expenditure on fixed capital, but also subsidies, social benefits and other transfers) of central and local government bodies, as well as public corporations.
Statistics published in May 2019 show:
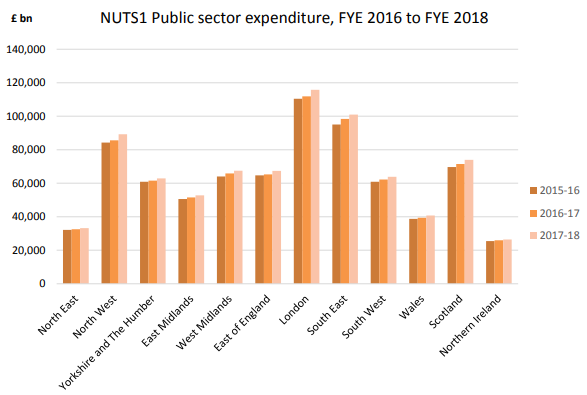
• London had the highest public sector expenditure at £115.8 billion in the financial year ending (FYE) 2018; the total for the UK was £794.8 billion.
• The lowest total public sector expenditure in the same year occurred in Northern Ireland at £26.5 billion.
• Figure 2 shows public sector expenditure for all NUTS1 countries and regions from FYE 2016 to FYE 2018.
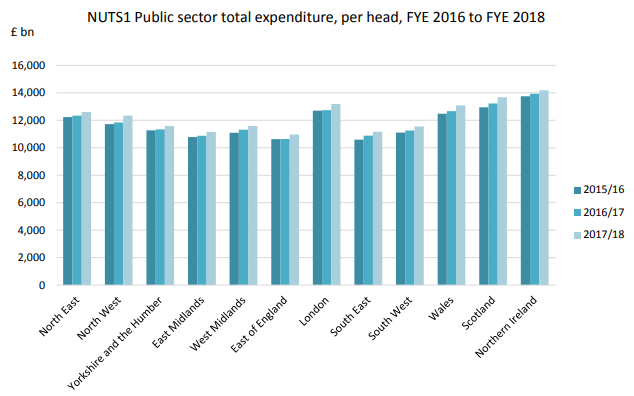
24. When taking into account the population of each country and region, a different picture can be seen for the FYE 2018:
• Public sector expenditure on a per-head basis in Northern Ireland was £14,195, the highest of all regions.
• While the lowest per head expenditure occurred in the East Midlands and the South East at £11,146 and £11,169 respectively.
• Figure 3 shows public sector total expenditure on a per head basis for each NUTS1 country and region.
25. The underlying data source for expenditure in the country and regional public sector finances is HM Treasury’s (HMT) Country and Regional Analysis. These data are presented on the basis
of the United Nation’s Classifications of Functions of Government, as are the expenditure data in the ONS’ country and regional public sector finances.
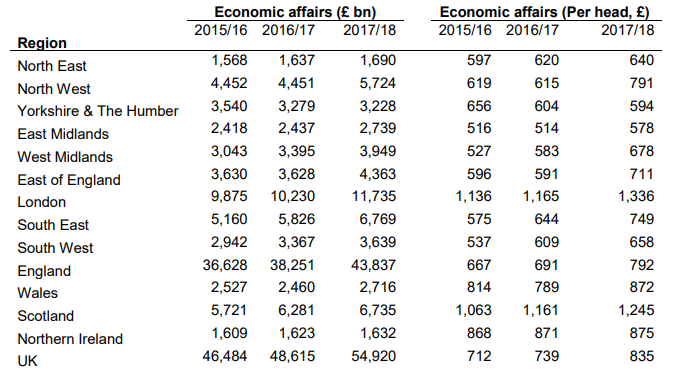
26. Though no definition of expenditure on ‘investment’ exists in this framework, some categories of expenditure can be considered to be related to investment, such as economic affairs and
housing.
27. Table 1 shows data from FYE 2016 to FYE 2018 for expenditure on economic affairs and housing for each NUTS1 country and region – spending in value terms and per head. While most expenditure for both categories in value terms occurs in London and the least in areas such as Northern Ireland and the North East, this is not the case when considering the population of each region. On a per head basis, the lowest expenditure generally occurs in Yorkshire and the Humber for economic affairs, and the South East for housing. Further breakdowns of data are available from the Country and Regional Analysis conducted by HMT.
Figure 2: NUTS1 public sector expenditure, FYE 2016 to FYE 2018
Source: Office for National Statistics
Figure 3: NUTS1 public sector expenditure, per head, FYE 2016 to FYE 2018
Source: Office for National Statistics

Source: Office for National Statistics
28. For all regions, most expenditure occurs in relation to social protection, namely expenditure on pensions, but also on social benefits. Further information on expenditure for other categories are published alongside the bulletin.
Revenue
29. Public sector revenue is the total current receipts received by central and local government as well as public corporations. These receipts predominantly relate to taxes, but also social
contributions, interest, dividends, gross operating surplus and transfers.
30. In the country and regional public sector finances, total public sector revenue in each NUTS1 country and region is presented, including North Sea revenue, on a population-share basis and
a geographic-share basis. Under the geographic-share basis, a greater share of North Sea revenue is allocated to Scotland.
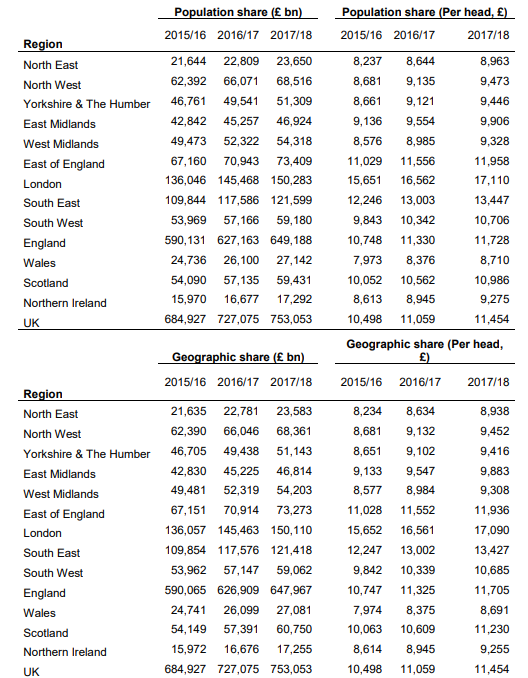
31. In the financial year ending (FYE) 2018:
• The most public sector revenue was raised in London at £150.2 billion on a populationshare basis and £150.3 billion on a geographic-share basis.
• The least revenue was raised in Northern Ireland at £17.3 billion on both bases of North Sea revenue.
• On a per-head basis, London raised £17,110, the highest of all regions; while the lowest per-head revenue was raised in Wales at £8,710.
• Table 2 shows these figures for FYE 2016 to FYE 2018.
Net fiscal balance
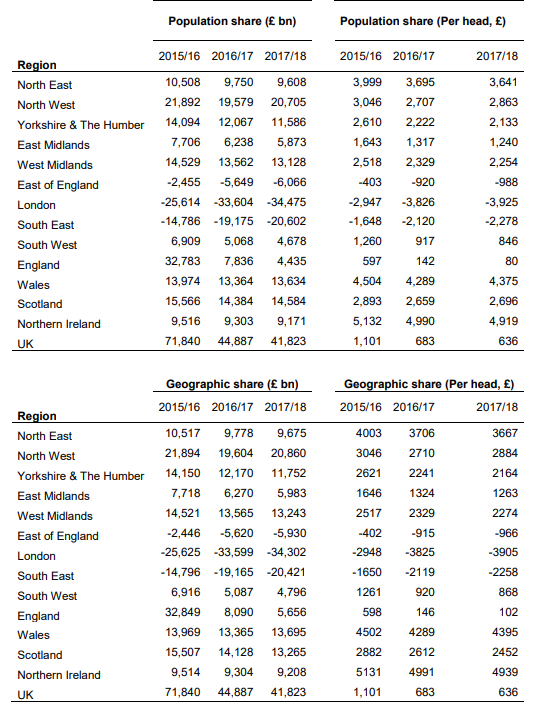
32. Net fiscal balance is the gap between total spending and revenue raised. At the UK level, this is equivalent to public sector net borrowing. A negative net fiscal balance figure represents a
surplus, meaning that a country or region is receiving in revenue more than is being spent for the benefit of residents or enterprises in that country or region. A positive net fiscal balance represents a deficit, meaning a country or region is attracting more expenditure for the benefit of its residents or enterprises than it is receiving in revenue. Figure 4 shows the net fiscal balance
for each NUTS1 country and region for the FYE 2018. Table 3 shows these figures for FYE 2016 to 2018.
Figure 4: Net fiscal balance for FYE 2018, by NUTS1 countries and region
Source: Office for National Statistics
Table 2: Public sector revenue, FYE 2016 to FYE 2018, by NUTS1 countries and regions
Source: Office for National Statistics
Table 3: Net fiscal balance, FYE 2016 to FYE 2018, by NUTS1 countries and regions
Source: Office for National Statistics
Engagement through Devolution Programme
33. Following the Spending Review in 2015, and the Independent Review of UK Economic Statistics by Sir Charles Bean, ONS has conducted several projects under its Devolution programme.
These projects had explicit aims of producing lower geographic breakdowns of statistics, including developments to Regional Accounts; Public Sector Finances; Sub-regional Productivity; estimates of exports of services; and engagement with local area users of statistics. Much of this work has now been completed and published on the ONS website.
34. In support of this programme, ONS created a Centre for Subnational Analysis which has been increasingly engaging with users of statistics. Such engagement included discovery workshops
conducted with the new Mayoral Combined Authorities; meetings with City Regions and City Growth Deals across the UK; presentations at conferences such as the Economic Forums; and the instigation of a new Combined Authorities Liaison Group where we bring users together to show and discuss statistical developments. It has also included direct involvement in the production of Local Industrial Strategies in collaboration with the Department for Business, Energy and Industrial Strategy, meetings with the What Works centres, and engagement with partner organisations including the Local Government Association, Centre for Cities and Core Cities.
35. This engagement has been supported by a continuous programme of work to improve current channels of dissemination, create new insights through forthcoming publications and meet the
specific needs of authorities through targeted support. Bespoke projects have included analysis of productivity to feed into Greater Manchester’s Independent Prosperity Review and of the impacts of building the Midlands Metro, in collaboration with Ordnance Survey. We are currently working to produce analytical articles and ad-hoc data tables which we expect to publish over the coming months in direct response to the needs identified by City Regions through our workshops. Those needs specifically included more information on economic growth, skills, the labour market, productivity and low pay, among other social and economic topics.