Dear Chair,
I write in response to the Business, Energy and Industrial Strategy Committee’s call for evidence for its inquiry on the impact of coronavirus on businesses and workers.
As the Committee will be aware, the Office for National Statistics (ONS) is the UK’s National Statistical Institute, and largest producer of official statistics. We aim to provide a firm evidence base for decision makers and develop the role of official statistics in democratic debate. To do this during the coronavirus (COVID-19) pandemic, we are regularly publishing detailed commentary on, and analysis of, the impacts of COVID-19 on the UK economy and society. Alongside our regular publications, a suite of COVID-19 related statistics are now available on the ONS website. These include faster indicators, social impacts , economic impacts, and furloughing of workers across UK businesses.
We have focused our evidence on the new analysis being published to highlight the immediate impacts of the pandemic on businesses and workers, and what the initial results of this analysis are.
We published the first of a new weekly series of faster indicators in response to COVID-19 on 2 April. The indicators use data from a variety of sources, including a new ONS Business Impact of Coronavirus Survey (BICS), which collects information on the financial and operational performance of businesses during the COVID-19 outbreak. The survey is voluntary, and therefore we caveat its results by noting that it may only reflect the characteristics of those businesses who responded. We have also introduced the Opinions and Lifestyle (OPN) Survey to help understand the impact of the COVID-19 pandemic on people, households, and communities in Great Britain. Together, these surveys provide a well-rounded view of the impact of the pandemic on both our businesses and our population. We have continued to add to the list of measures that are published as part of the faster indicators, reflecting the changing impacts of the pandemic as well as our ability to ring new data sources online and provide new and innovative analysis.
Economic activity
Gross domestic product (GDP) fell by 2.0% in the three months to March 2020 (Q1), signalling the first direct impacts of the coronavirus (COVID-19) on the economy. All the headline sectors provided a negative contribution to growth. The services sector fell by 1.9%, production by 2.1%, construction by 2.6%, and agriculture by 0.2%. The impacts of COVID-19 were seen right across the economy, with nearly all subsectors falling in the three months to March.
Monthly GDP fell by 5.8% in March 2020, the biggest monthly fall since the series began in 1997. Services and construction also saw record falls in the most recent month. This reflects the first government advice on social distancing, published on 12 March 2020, and introduction of restrictions in movement across the UK, which began on 23 March 2020. It should be noted that monthly GDP is volatile and should therefore be used with caution and alongside other measures.
Figure 1. Index of services: Rolling three-month on three-month index, January to March 2019 until January to March 2020 (January to March 2019 = 100)
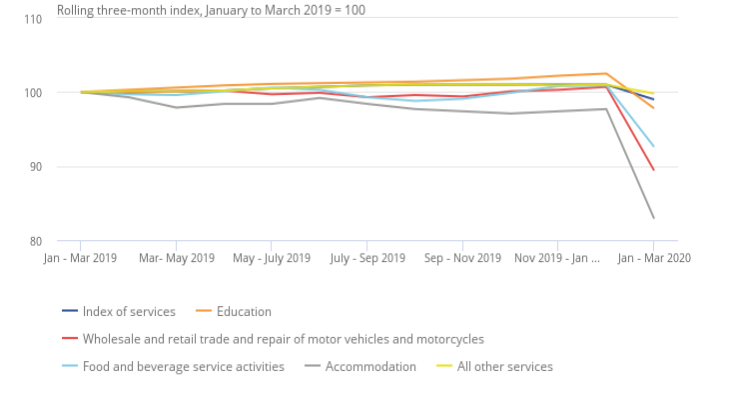
Source: Office for National Statistics – GDP monthly estimate
Analysis of our Monthly Business Survey (MBS) returns and external data, including comments from over 10,000 businesses, demonstrated that the arrival of the coronavirus (COVID-19) pandemic had a significant and broad-based negative impact on output during March 2020, though some industries did see a positive impact. This was caused by a complex mix of factors, including the effects of social distancing, which led to a fall in consumer demand, business and factory closures and supply chain disruptions. The bulletin contains detailed industry analysis. To give one example, following a steady decline in growth from January 2008 to February 2020, COVID-19 had a significant negative effect on travel and tourism in March 2020.
Figure 2. Index of production: Rolling three-month on three-month index, January to March 2019 until January to March 2020 (January to March 2019 = 100)
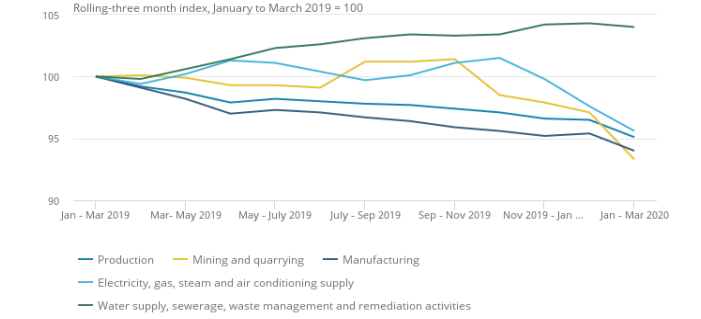
Source: Office for National Statistics – GDP monthly estimate
Business Impact of Coronavirus (COVID-19) Survey (BICS)
The BICS was stood up within the first two weeks of lockdown and is sent out to a large sample of UK businesses each fortnight. We call each return period a wave. We have changed a number of the questions on the survey over that time, to reflect that business impacts are changing and adapting in different ways. This new online survey provides a timely and useful snapshot of the impact of COVID-10 on business conditions and sentiment; we anticipate continuing with the survey, and refining it, for some time.
Business operations
Initial results from Wave 4 of BICS (the period from 20 April 2020 to 3 May 2020) showed that over a fifth (22%) of businesses that responded had temporarily closed or paused trading, while less than 1% had permanently ceased trading.
Of the businesses that responded, 77% reported that they were continuing to trade during this period. Of those, only 6% responded that they had started trading again during the reference period. Of those who had paused trading, 99% reported that they had done so prior to 20 April.
Of all business trading during the period, 61% reported that their turnover had decreased to some extent when compared with normal. A quarter of trading businesses reported their turnover decreased by more than 50%, while 32% reported that turnover was within the normal range.
International trade
Businesses exporting goods and services reported that the most common challenges faced in exporting during the period were COVID-19-related transport restrictions (44%), followed by reported increases in transportation costs (28%). However, almost two-fifths (39%) of exporting businesses reported they did not experience any challenges in exporting.
Transport restrictions due to COVID-19 were also the most cited challenges for importing business (50%), followed by increasing costs for transportation (29%). Similarly to exporting businesses, 33% of importing businesses reported they did not experience any challenges in importing.
Figure 3. Businesses (exporting/importing goods or services) continuing to trade and with financial performance outside of normal expectations, UK, 20 April to 3 May 2020
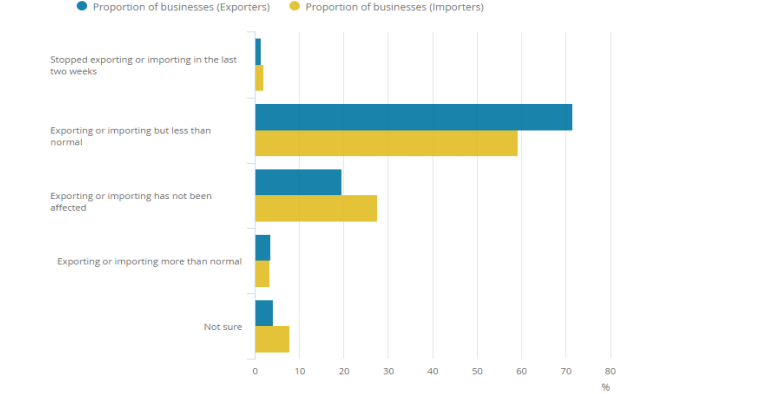
Source: Office for National Statistics – Business Impact of Coronavirus Survey
Figure 3 refers only to businesses continuing to trade, who reported their financial performance was outside normal expectations between 20 April and 3 May and were continuing to export or import. It does not include businesses whose financial performance was within normal expectations. 72% of exporting businesses reported that their business was still exporting but less than normal, while 59% of importing businesses said they were importing less than normal. ( Initial results, Wave 4 of ONS Business Impact of Coronavirus (COVID-19) Survey. (Exports: n = 701 Imports: n =927))
Government support schemes
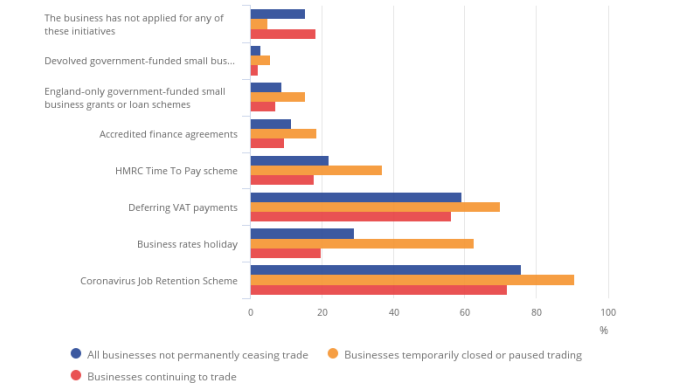
For the businesses that responded to BICS Wave 4, the two most popular government support schemes to apply for among businesses that had not permanently ceased trading were the coronavirus Job Retention Scheme (CJRS) (76%) and the Deferring VAT Payments Scheme (59%), (Figure 4).
Around 91% of business who had paused trading applied for the Coronavirus Job Retention Scheme, compared with 72% of businesses who were still trading.
Figure 4. Percentage of all government schemes applied for, businesses continuing to trade and paused trading, UK, 20 April to 3 May 2020
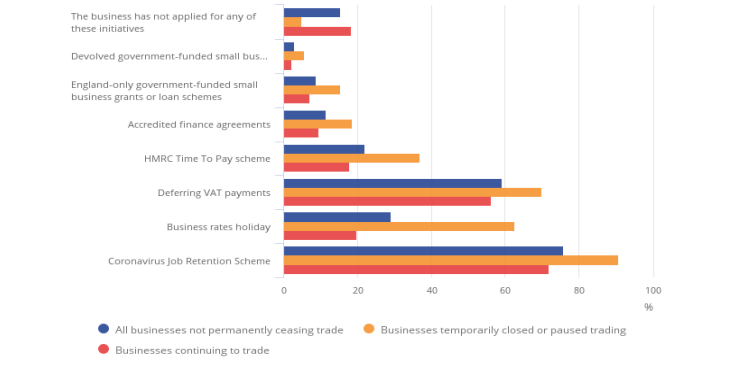
Source: Office for National Statistics – Business Impact of Coronavirus Survey
Bars will not sum to 100% as businesses are able to select more than one government scheme
‘Initial results, Wave 4 of ONS Business Impact of Coronavirus (COVID-19) Survey that are either continuing to trade or who have temporarily paused or ceased trading.
Workforce impact
Employees of businesses that are still trading or have paused trading will experience different impacts, whether furloughing staff, working as normal, or operating in other scenarios. Table 1 identifies the proportion of employees within businesses that have been furloughed, been made redundant, or are continuing to work, broken down by industry and apportioned by employment size.
Estimates of workforce proportions for each industry were based on the employment recorded for that reporting unit on the Inter-Departmental Business Register (IDBR). While this method is likely to provide broadly accurate industry estimates, they cannot be grossed up to provide representative UK-wide estimates.
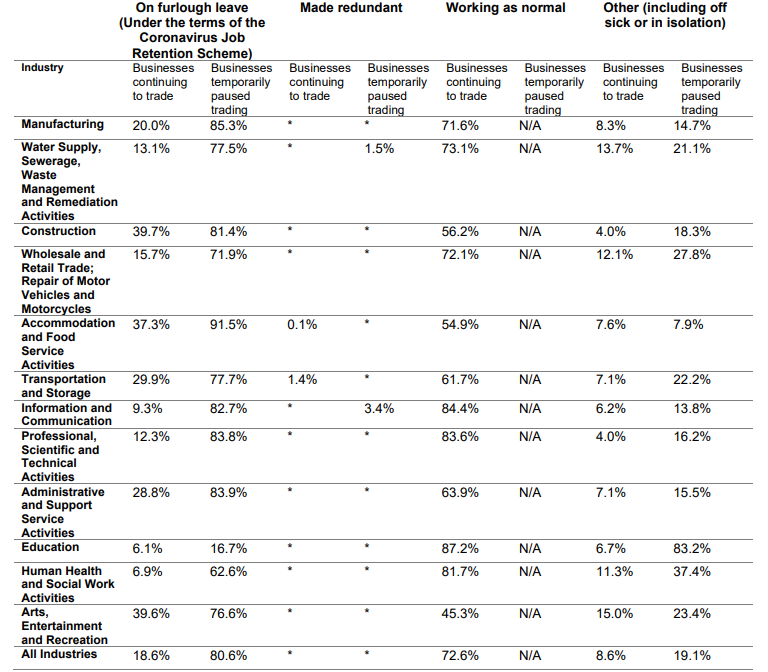
Table 1: Proportion of the workforce that had been furloughed, made redundant, are continuing to work or any other reason, for responding businesses that are continuing to trade or temporarily paused trading, apportioned by employment size, UK, 6 April to 19 April 2020
-
The apportionment of workforce methodology used for these data does not involve grossing for UK wide estimation.
-
This table of data represents the proportion of responses to each question from businesses. This is apportioned using the employment recorded for each Reporting Unit on the Interdepartmental Business Register (IDBR).
-
Real Estate Services, Other Services and Mining and Quarrying have been removed due to their low response rate, but their totals are included in ‘All industries’.
-
Final results, Wave 3 of ONS Business Impact of Coronavirus (COVID-19) Survey that are continuing to trade and
-
temporarily paused trading, apportioned by employment size.
-
The percentages in this chart may not sum to 100% due to rounding
-
Businesses who responded as temporarily pausing trade, were not asked to report levels of staff sickness or selfisolation, whilst Businesses who responded as continuing to trade were. To enable comparison between businesses who have paused trading and who have continued trading, the categories “Other” and “Off sick or in self-isolation due to coronavirus (COVID-19) with statutory or company pay” have been summed together into “Other (including sick pay and self-isolation)”.
In the reference period 6 April to 19 April 2020, 19% of the workforce had been furloughed across businesses continuing to trade, compared to 81% of those who had temporarily closed or paused trading. Less than 1% of the workforce had been made redundant across responding businesses.
The proportion of the workforce that had been furloughed across responding businesses varied substantially between industries, and it depended on whether the business employing them was still trading or had temporarily paused its activities.
Figure 5 shows that the highest proportions of workforce being furloughed, of those businesses continuing to trade or having temporarily paused trading combined, were recorded in the accommodation and food service activities industry (73%) and in the art, entertainment, and recreation industry (70%).
Figure 5. Rates of businesses on furlough leave (under the terms of the UK Government’s Coronavirus Job Retention Scheme), 6 April to 19 April 2020
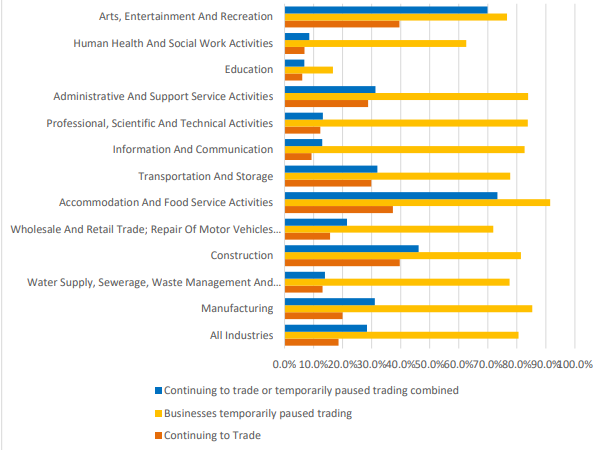
Source: Office for National Statistics – Business Impact of Coronavirus Survey
Business cash flow
Businesses that had not permanently ceased trading were also asked how long they thought their cash reserves would last in Wave 4. Initial results were that businesses which had temporarily closed or had paused trading were much more likely to report having less than six months’ cash reserves (59%) than more than six months (11%). For businesses continuing to trade, two-fifths (40%) reported they had less than six months’ cash reserves, while around two-thirds (32%) said they had more than six months. Around a quarter of responding businesses were unsure how long their cash reserves would last. (These are initial results and may be revised. Final results for Wave 4, with more detailed breakdowns, will be published in Coronavirus, the UK economy and society, faster indicators)
Figure 6. Cash reserves, businesses continuing to trade and paused trading, broken down by trading status, UK, 20 April to 3 May 2020
Source: Office for National Statistics – Business Impact of Coronavirus Survey
Labour Market Statistics
The ONS statistics on the labour market include both detailed but less timely survey data from the Labour Force Survey, and more up to date indicators including administrative data from HM Revenue and Customs and the Department for Work and Pensions. We have also rolled out a new on-line Labour Market Survey, and initial results from that are due to be published in the coming weeks.
In March, there was little sign of significant change to employment or unemployment. However, we are able to see how the COVID-19 restrictions affected the labour market using some new and experimental singleweek data from the Labour Force Survey. These data, which only cover the first few weeks of lockdown restrictions, show hours worked fell by around 25 per cent in the last week of March compared to usual, as workers were either furloughed or saw their hours reduced.
Throughout April there were signs of falling employment as real-time tax data show the number of employees on companies’ payrolls fell by around 450,000 compared to March. There was also a large rise in the ‘claimant count’ though care needs to be taken with this figure as it is possible to still be working and included in the claimant count. We also saw vacancies fall sharply in April.
The Opinions and Lifestyle Survey (OPN)
The Opinions and Lifestyle Survey (OPN) is a regular omnibus survey. In response to the coronavirus (COVID-19) pandemic, we have adapted the OPN to become a weekly survey used to collect data on the impact of the coronavirus on day-to-day life in Great Britain. The survey results are weighted to be a nationally representative sample for Great Britain, and data are primarily collected using an online selfcompletion questionnaire.
Working from home
Final results for Wave 6 of the OPN (covering period 24 April to 3 May 2020) showed the same proportion of adults in employment saying they had worked from home at some point this week (44%) compared with the previous week.
This consisted of 36% of adults who had only worked from home, and 9% who had both worked from homeand travelled to work (both key workers and non-key workers). A further 26% of adults In employment said they had travelled to work in the last seven days and had not worked from home.
Key workers
The ONS recently published analysis giving an indication of the number of people who were employed in 2019 in key worker occupations and key worker industries. The key worker occupations and industries are based on an interpretation of UK government guidance that defines who is eligible for childcare places. Key workers are also defined in Department of Health and Social Care guidance on testing eligibility. The ONS’ analysis is based on various sources: The Annual Population Survey, the Labour Force Survey and the Annual Survey of Hours and Earnings.
In 2019, around 10.6 million of those employed (33% of the total workforce) were in key worker occupations and industries. The largest group of those employed in key worker occupations worked in health and social care (31%). Figure 7 shows the number of key workers by occupation group.
Figure 7: The largest group of key workers worked in health and social care.
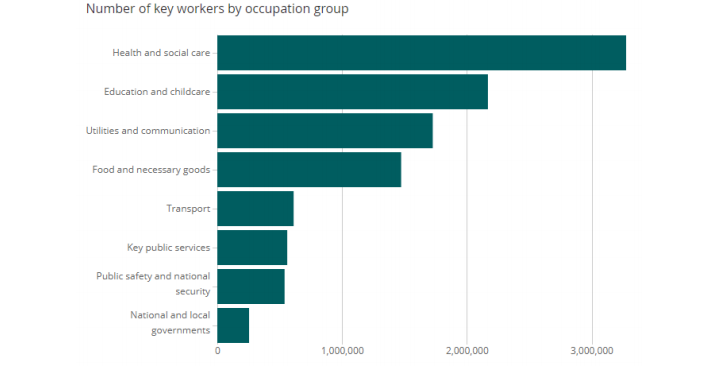
Source: Office for National Statistics – Annual Population Survey
Among key workers, 58% were women and 42% were men. These proportions differ to that of women and men in non-key worker roles (42% and 58% respectively). However, the gender split was very different within different occupation groups. Women were most represented in education and childcare (81%), and health and social care (79%). Conversely, the majority of workers in transport occupations were male (90%).
The majority of key workers were of White ethnicity (86%), with 14% belonging to an ethnic minority. The ethnic minority categories included Black/African, Asian, mixed and other. Of these categories, Asian and Black/African had the highest proportions of key workers at 8% and 4% respectively. Key workers who were of an ethnic minority were most represented in health and social care (16%).
When surveyed in the OPN, 75% of all key workers said they are very or somewhat worried about the effect the coronavirus is having on their life. The most common issue affecting key workers was the impact on their work, with 46% saying this was the case, and 35% saying concerns with their health and safety were a
reason for this. The most cited reasons for concerns around health and safety were difficulty in following
social distancing advice (86%) and a limited amount of or no protective clothing being available (41%).
Deaths related to COVID-19
The ONS has published additional analysis looking at how deaths in England and Wales related to COVID19 vary by occupation, and also on the occupations in the UK that have the highest potential exposure to COVID-19. The two articles show that, generally, occupations with the most frequent and close interaction with others have greater exposure to disease and some of these occupations also have high rates of COVID-19 deaths.
There was a total of 2,494 deaths involving the coronavirus (COVID-19) in the working age population (those aged 20 to 64 years) of England and Wales were registered up to and including 20 April 2020. Nearly two-thirds of these deaths were among men (1,612 deaths), with the rate of death involving COVID19 being statistically higher in males, with 9.9 deaths per 100,000 compared with 5.2 deaths per 100,000 females (882 deaths).
Compared with the rate among people of the same sex and age in England and Wales, men working in the lowest skilled occupations had the highest rate of death involving COVID-19, with 21.4 deaths per 100,000 males (225 deaths); men working as security guards had one of the highest rates, with 45.7 deaths per 100,000 (63 deaths).
Men and women working in social care, a group including care workers and home carers, both had significantly raised rates of death involving COVID-19, with rates of 23.4 deaths per 100,000 males (45 deaths) and 9.6 deaths per 100,000 females (86 deaths).
Healthcare workers, including those with jobs such as doctors and nurses, were not found to have higher rates of death involving COVID-19 when compared with the rate among those whose death involved COVID-19 of the same age and sex in the general population.
Among men, a number of other specific occupations were found to have raised rates of death involving COVID-19, including: taxi drivers and chauffeurs (36.4 deaths per 100,000); bus and coach drivers (26.4 deaths per 100,000); chefs (35.9 deaths per 100,000); and sales and retail assistants (19.8 deaths per 100,000).
This analysis does not prove conclusively that the observed rates of death involving COVID-19 are necessarily caused by differences in occupational exposure; we adjusted for age, but not for other factors such as ethnic group and place of residence.
Potential exposure to COVID-19 by occupation
We have obtained an estimate of exposure to disease (generally) and physical proximity for UK occupations based on US analysis of these factors, using 2019 data. While working practices and
conditions may be slightly different in the US for similar occupations, these estimates offer valuable insight into occupations that involve working in close proximity with others and those that are regularly exposed to diseases. This is a useful indication of which roles may be more likely to come into contact with people with COVID-19, based on what these roles normally entail.
There is a clear correlation between exposure to disease, and physical proximity to others across all occupations. Healthcare workers such as nurses and dental practitioners unsurprisingly both involve being exposed to disease on a daily basis, and they require close contact with others, though during the pandemic they are more likely to be using PPE.
Our analysis also looks at the characteristics of workers in occupations which are more likely to be in close contact with people and also frequently exposed to disease. Three in four workers in these roles are women. One in five of those working in these occupations are 55 or older, the same as in the working population generally. However, around half of those employed as care escorts are 55 or over. Also, one in five workers in these occupations are from black and minority ethnic groups, compared with just over one in 10 of the working population.
Challenges for economic statistics
The disruption from COVID-19 has made for challenges in measuring the economic and compiling many of our regular economic statistics. These challenges broadly fall into three main categories:
• Conceptual challenges; how should the various phenomena we are observing be accounted for in our economic statistics?
• Data collection problems; how do we keep collecting data when some companies are not trading or when we cannot send people to interview households or record prices from shops?
• Methodological concerns; how do we adjust our raw data, given the way our economy functions has changed so significantly?
Conceptual challenges
There are multiple conceptual challenges that the ONS has needed to consider separately to produce meaningful statistics. These include:
• Determining the correct treatment of the Coronavirus Job Retention Scheme in the National Accounts. After considering the Scheme and National Accounts guidance, we have decided to count the scheme as a subsidy to business, netting it off the income measure of GDP, as the furloughed employees will continue to count as employed and the payments they receive from their employer as wages and salaries.
• How to measure education output when children are not in school? Our approach is to calculate output including a new measure of remote learning, with appropriate adjustments for teacher input and parental support.
• Measuring inflation when some goods and services are not available, or where the number of prices collected is small. We will be using methods such as assuming their prices would have moved in line with the average movement for related goods and services, or the overall index. This is the simplest approach that comes as close as possible to reflecting that the supply of certain goods and services has been interrupted.
Data collection challenge
Many economic statistics produced by the ONS are underpinned by business and household surveys. For example, we survey firms to measure GDP and to collect prices to measure inflation, and survey individuals to understand their employment status. A number of our surveys have been understandably disrupted due to businesses temporarily closing or having employees work from their homes. For shops and services that are closed or under restricted operation, we can no longer send people there to collect their prices. All of this means we are relying more on remote-data collection, over the phone or online. Such sudden changes can result in a lower response rate.
Methodological challenges
In general, one of the most common issues we deal with is when firms or businesses do not respond to our survey, or where data are late for other reasons. When that happens, we must fill in gaps in our data collection, technically known as imputation. Normally, we can do this by using historical relationships between different data sources. But those historical relationships may not hold given the current crisis.
Addressing the challenges
To address these issues, we have been looking to develop new data sources that shed light on specific economic issues, such as how businesses are changing their employment practices. They can also help us cross-check our core economic data and inform the judgements we need to make. As discussed above, we have created new surveys that can help us fill the gaps and are using administrative data such as information from HMRC on employees being paid through ‘real time information’. We also continue to work with businesses to gain access to valuable economic data.
Secondly, we have been drawing on expertise within the ONS, international statistical bodies and the academic community. There are skilled methodologists in the ONS who are helping us develop approaches to dealing with missing data. We also have, for example, an expert technical panel which supports us on inflation measurement and can look to international guidance and practice to inform decisions.
Lastly, we are being as transparent as possible about the issues and how we are addressing them. We have published detailed articles laying out how we will continue to produce GDP, labour market, and prices data to ensure transparency in these processes. These are unprecedented times and there is scope for more revisions than normal. We have made some changes to our publication schedule to account for the challenges we are facing, and these are included in the articles too.
As the ONS continues to publish analysis of the impact of COVID-19 on businesses and workers, we would be happy to keep the Committee informed. Please do not hesitate to contact me if I can be of any further assistance.
Yours sincerely,
Jonathan Athow
Deputy National Statistician and Director General, Economic Statistics Office for National Statistics