Dear Lord Bridges,
Thank you for inviting David Freeman and I to give evidence for the Committee’s inquiry on UK Labour Supply. During that session on 6 September, we promised to follow-up with the Committee on several topics.
Over-50s Lifestyle Survey
The latest iteration of the Over-50s Lifestyle Survey was discussed at many points during the session, and I am pleased to confirm it was published on 27 September 2022. In the period from 10 to 29 August 2022, based on adults aged 50 to 65 years in Great Britain (GB) who have left or lost their job since the start of the coronavirus (COVID-19) pandemic and not returned to work:
- The majority (66%) owned their homes outright and were more likely to be debt free (61%) compared with those who left their job since the pandemic and returned to work (42% debt free).
- Financial resilience varied by age: those aged 50 to 54 years were significantly less likely to be debt free, excluding a mortgage (49%), compared with those aged 60 to 65 years (62%), and more likely to have credit card debt (39%, compared with 24%).
- Age was also a factor when considering whether to return to work; the younger cohort were more likely to say that they would consider returning to work (86% for those aged 50 to 54 years, 65% for those aged 55 to 59 years and 44% for those 60 to 65 years).
- Adults aged 50 to 59 years were more likely to report mental health reasons (8%) and disability (8%) as a reason for not returning to work when compared with those aged 60 to 65 years (3% and 3%, respectively).
- Adults aged 50 to 59 years (14%) were also more likely to be currently looking for paid work, compared with adults aged 60 to 65 (6%).
- Among those who would consider returning to work (58%), the most important factors when choosing a paid job were flexible working hours (32%), good pay (23%), and being able to work from home (12%).
- Around 1 in 5 (18%) said they were currently on an NHS waiting list for medical treatment; this rose to 35% for those who left their previous job for a health-related condition.
The Over-50s Lifestyle Survey is a cross-sectional survey. This means that different respondents have answered each wave of the questionnaire and therefore changes are not directly comparable.
Older people in the labour market
Separately, we released a publication on older people in the labour market using Labour Force Survey (LFS) data on 12 September, which found that from April to June 2022, people aged 65 and over in employment increased by a record 173,000 to 1.468 million. However, this increase was driven by rises in part-time work, and therefore the average hours worked for those aged 65 and over fell in the same time period.
Long-term sickness
We considered the increases in long-term sickness among the economically inactive, and the guidance we give field officers working on the LFS when asking this question. To explain further, the issue of long-term or chronic illness is addressed in two different parts of the LFS.
There is a section on health, that looks at whether people have health conditions or illnesses lasting or expecting to last 12 months or more. However, this section is looking generally at disabilities and health conditions, rather than being directly related to labour market status.
The long-term sickness series that was referenced during our discussion relates to people who give long-term sickness as the main reason why they are neither in work (employed) or searching for work (unemployed).
Once establishing that someone is neither in work nor searching for work, they are asked:
May I just check, what were the reasons you did not look for work (in the last 4 weeks)?
- Waiting for the results of an application for a job/being assessed by a training agent
- Student
- Looking after the family/home
- Temporarily sick or injured
- Long-term sick or disabled
- Believe(s) no jobs available
- Not yet started looking
- Do(does) not need employment
- Retired from paid work
- Any other reason
Following this, they are asked which of these is their main reason for not looking for work, which is used for classifying them within the labour market framework. The only further guidance the respondent may be given relating to sickness is if they are unsure whether to classify their sickness as temporary or long-term. The interviewer would indicate that long-term would be one that has lasted, or is expected to last, 12 months or more.
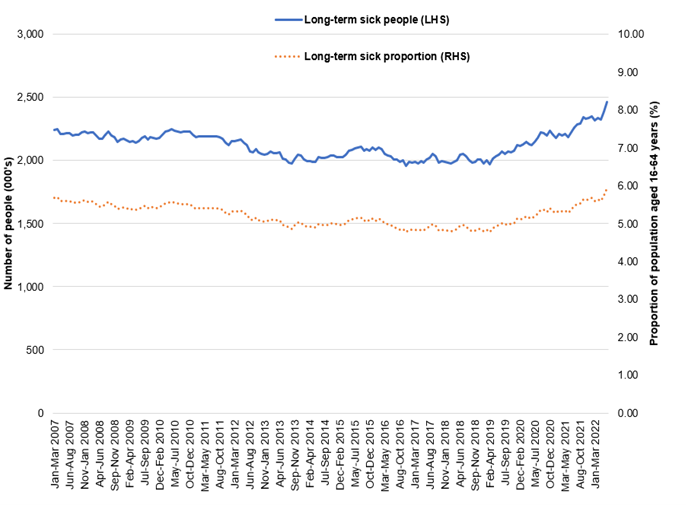
The long-term time series for long-term sickness in the labour market can be found on our website. Figure 1 shows that the number of people who are economically inactive mainly due to long-term sickness has risen to a record high, but not a record proportion of the population aged 16 to 64 years.
Figure 1: The number of people who are economically inactive mainly due to long-term sickness
Source: Office for National Statistics – Labour Force Survey For a more accessible version, please visit our accessibility policy.
Due to sample size limitations, we do not routinely publish estimates of long-term sickness at a regional level from the LFS. However, using the Annual Population Survey (APS), we do publish estimates of long-term sick as the main reason for economic inactivity at a regional level. This dataset allows you to access estimates of economic inactivity by region by sex by main reason for inactivity.
Trends in self-employed
During the session, we discussed the movement of those who are self-employed to employed during the pandemic, and whether these were real changes in employment status rather than reclassification. It is difficult to put a figure on the numbers that fall into different reasons for changing from self-employed to employee status during the pandemic.
Even prior to the pandemic a significant number of respondents would report that they were an employee in one period and self-employed in another period, despite also reporting that they hadn’t changed jobs. In general, the net flow of this has been around 20-30,000 per quarter. Similarly, those who reported that they had changed jobs between interviews had a general net flow of around 10-20,000 per quarter prior to the pandemic.
During the pandemic, both flows shifted from a net flow from employee to self-employed, to people changing their status from self-employed to employee. In the case of those who hadn’t changed jobs, there was a net flow of around 350,000 from self-employed to employee for people who had not changed jobs, compared with around 100,000 for those who had.
We published an article in July looking at changes in self-employment in the UK from January 2020-March 2022, which noted that large increases in the number of self-employed workers remaining in the same job but reclassifying their labour market status to “employee” were observed between April and September 2020 (coinciding with the introduction of the furlough scheme), most commonly among business directors and partners, and those in high-skilled occupations. Self-employment had fallen across all industries, most notably in construction (although construction remained the largest self-employment industry).
Quality of employment
David mentioned in the session that we had previously completed analysis looking at quality of jobs, which we did by using APS data for 2018. Work is currently underway on a 2021 ‘Quality Jobs’ publication, expanding on the previous methodology to include more dimensions of job quality. For time series purposes, this year’s publication will reproduce the 2018 analysis with 2021 APS data (i.e., low pay, satisfactory hours & desired contract). It will also add new dimensions on career progression, employee involvement, overtime and zero-hour contracts.
In future, we plan to produce this report annually and make this a regular output. The current expected date for the 2021 publication is December 2022 and we will share with the Committee once published.
We also have information which reflects labour market status by highest level of qualification. It shows a positive relationship between qualification and likelihood of being employed, with those educated to degree level having a much higher employment rate than any other category and those with no qualifications having a much lower employment rate than any other category. Between those two extremes, there is still a positive correlation with higher level of qualification, but the spread is less marked than those two extremes.
Vacancies
Unfortunately, we do not produce estimates of the number of vacancies in the UK broken down into the public and private sectors. The closest approximation we can make is to look at estimates by industry, making assumptions around their public/private splits based on employment statistics which are available with a sector breakdown.
Table 1 summarises the overall position for the UK and for relevant industries both for the latest movements, as well as change since the pre-pandemic period.
| UK | Public Admin | Education | Health | |
|---|---|---|---|---|
| Public Sector Share of Employees (BRES) | 18% | 99% | 57% | 48% |
| Vacancies in Jun-Aug 2022 | 1.266m | 41,000 | 74,000 | 219,000 |
| Quarterly Change | -34,000 -2.6% | +3,000 +9% | +3,000 +3.6% | +7,000 +3.4% |
| Change since Jan-Mar 2020 | +470,000 +59% | +19,000 +86.4% | +25,000 +51.0% | +83,000 +61.0% |
For Public Administration and Defence, 99% of employees were in the public sector therefore we can be confident that overall vacancy trends for this industry will also be in the public sector. In the latest period, June-August 2022, there were 41,000 vacancies in this industry, an increase of 3,000 (9%) on the quarter. The number of vacancies in this industry was 19,000 (86%) above its pre-pandemic level (Jan-Mar 2020).
The other two sectors worth exploring are Human Health and Social Work activities and Education, which respectively are comprised of 48% and 57% public sector employees. The more even public/private split within these industries makes it more difficult to interpret whether vacancy trends are more or less concentrated in one sector the other.
Focusing firstly on Education, the number of vacancies in Jun-Aug 2022 was 74,000, an increase of 3,000 (3.6%) on the quarter and 25,000 (51%) when compared with Jan-Mar 2020. Looking then at Health and Social Work there were 219,000 vacancies in the latest period, an increase of 7,000 (3.4%) on the quarter, and 83,000 (61%) compared with Jan-Mar 2020.
What can be seen across all three industries is that the latest quarterly change saw an increase in the number of vacancies, moving in the opposite direction to the overall UK picture and to the majority of other industries. Looking at the pre-pandemic comparisons, if we exclude the smallest industries which can often show large proportional changes, only Accommodation and food service activities had a larger percentage increase in the number of vacancies (97.6%) than Public Administration. The changes for Education and Health were more in line with the national average, though as noted above recent movements were not.
EU Exit impact
The Committee were interested in understanding the sectors that have had migration impacts. The fall in employment seen since 2016 have been largely driven by UK nationals as shown in the Changing Trends and Recent Shortages in the Labour Market publication1. In the 12 months to September 2020, the number of EU workers increased by 119,000 when compared with the same period in 2016. The change on the year from October to September 2020 to October to September 2021 saw a fall of 91,000 EU workers, suggesting a possible pandemic effect.
Payrolled employment counts from HMRC showed the same signal of a fall in EU workers, indeed, the magnitude was higher using this measure, though comparing a longer time period. Between June 2019 and June 2021, payrolled employments held by EU nationals fell by 6% (171,100). This was offset by non-EU nationals, which increased by 9% (186,300) in the same period. There is a lot of variation at industry level, meaning changes in the makeup of migration could be affecting some industries more than others.
In the same period, the largest decline in total payrolled employments was seen in Accommodation and food services; this was driven by a 25% (98,400) fall in payrolled employments of EU nationals during the two years up to June 2021. There were also large falls by EU employments in Agriculture, forestry and fishing and Arts, entertainment and recreation. These sectors also saw falls in non-EU employments. Indeed, the three sectors that saw the largest growth of EU and non-EU employments were the same: Construction, Transportation and storage and construction and Health and social work.
According to the Business Insights and Impact on the UK Economy Survey, looking at why businesses are experiencing vacancies, a year ago (23 August to 5 September 2021) a quarter of businesses who were experiencing difficulties recruiting cited reduced numbers of EU applicants. This has gradually declined to 12 per cent (as of June 2022) as EU migrants have returned to the workforce.
International comparisons
During the session we discussed international comparisons. The latest data for this show that the UK has maintained relatively strong employment within the G7 throughout 2021 and into 2022. However, like the United States, the UK employment rate is still below pre-pandemic rates. We publish a monthly update on our website.
I hope this is helpful to the Committee, and please do let me know if we can assist further as the inquiry progresses.
Yours sincerely,
Mike Keoghan