Dear Mr MacNeil,
I write in response to the International Trade Committee’s call for evidence for its inquiry into inward foreign direct investment (FDI).
As the Committee will be aware, the Office for National Statistics (ONS) is the National Statistical Institute for the UK and the largest producer of official statistics. The ONS aims to provide a firm evidence base for sound decisions and develop the role of official statistics in democratic debate.
The ONS produces and publishes official statistics measuring many aspects of the cross-border activity of UK residents with the rest of the world. This note summarises the latest trends in foreign direct investment and mergers and acquisitions involving UK companies.
Additionally, I also write to update the Committee on the comprehensive transformation programme to develop FDI statistics initiated in April 2019, and progress made since we wrote to the Committee in September 2019.
I hope the Committee finds this submission useful. Please do not hesitate to contact me if I can be of any assistance.
Yours sincerely,
Jonathan Athow
Office for National Statistics (ONS) written evidence – Inward Foreign Direct Investment Inquiry
UK foreign direct investment, and mergers & acquisitions
FDI positions
The ONS produces statistics on the cross-border transactions of companies with links to the UK. Our latest statistical bulletin showed that the value of the stock of direct investment in the UK controlled by foreign companies (inward position) has followed an upward trend since 2010 (Figure 1).
By contrast, the stock of direct investments in other countries controlled by UK companies (outward position) was stable between 2010 and 2015, before increasing from then to 2019. The faster growth for the inward compared with the outward FDI position since 2010 has seen the UK’s net FDI position (outward less inward) fall and become negative in 2017, 2018 and 2019.
Figure 1: UK foreign direct investment positions with net position balance, 2010 to 2019
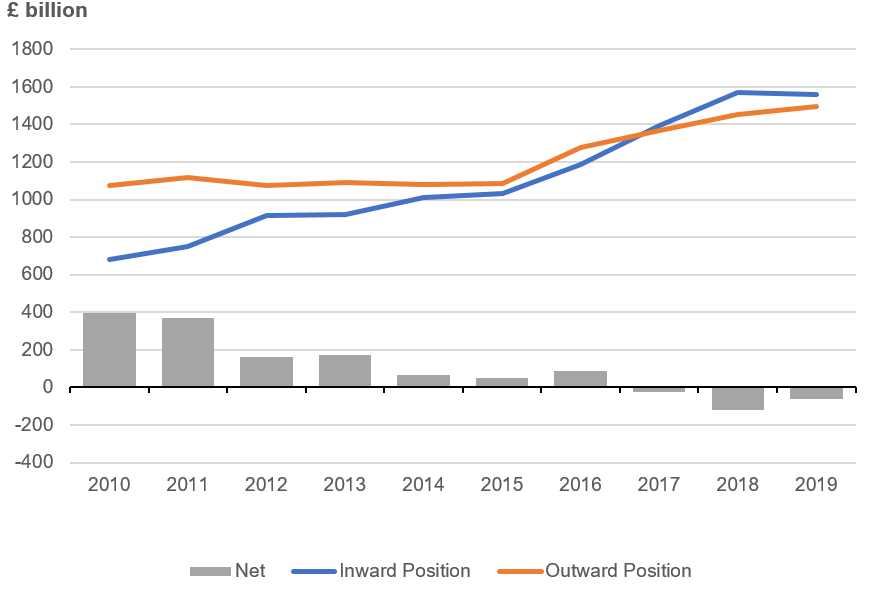
Source: Office for National Statistics – Foreign Direct Investment Survey. For a more accessible version, please visit our accessibility policy.
Notes: This figure uses directional statistics.
FDI earnings
There is also information available on FDI earnings, which are the profits generated on that stock of investment. Our latest published analysis showed that the value of inward FDI earnings fell considerably in 2019 from 2018 while there was only a slight fall in the value of outward earnings (Figure 2). Our analysis showed that this notable fall in inward FDI earnings was seen across FDI for most continents and industries. Furthermore, microdata analysis noted that the lower inward earnings was from companies reporting lower values in 2019 compared with their records in 2018.
Figure 2: Earnings on UK foreign direct investment with net earnings balance, 2010 to 2019
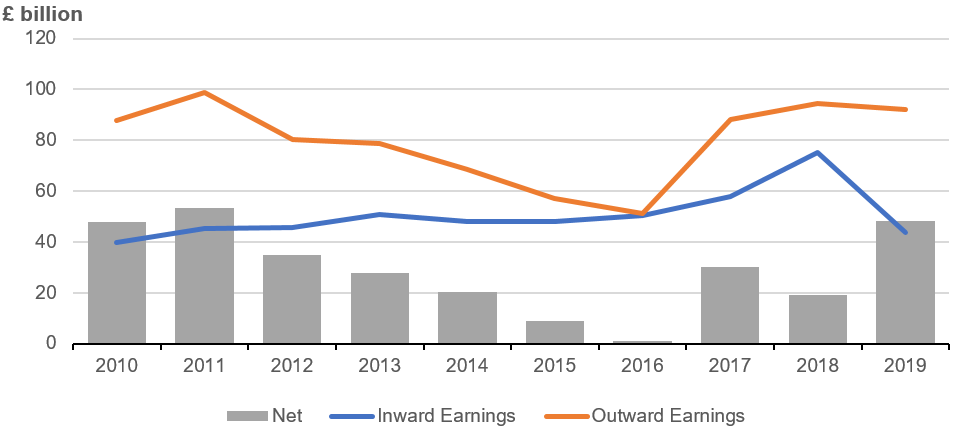
Source: Office for National Statistics – Foreign Direct Investment Survey. For a more accessible version, please visit our accessibility policy.
Notes: This figure uses directional statistics.
Like outward FDI, the longer-term trend in FDI earnings also shows that these values have converged. Inward FDI earnings have followed a gradual upward trend between 2010 and 2017, whereas those for outward earnings fell between 2011 and 2016. This saw net FDI earnings, which is when outward FDI is less than inward, become very close to zero in 2016. Our previous analysis identified implied rates of return on FDI assets being a contributor to falling FDI earnings between 2011 and 2016.
Net FDI income is a component of the current account using FDI asset and liability statistics, which are consistent with the balance of payments. Our last FDI asset and liability bulletin was published in February 2020. Those statistical tables are now published at the same time as the FDI directional bulletin. International guidelines allow for FDI statistics to be presented using either the directional or asset and liability basis. Foreign direct investment measurement principles explained provides an illustrative example of how statistics can be compiled from the same survey information. The net values and underlying trends in related statistics will be the same whichever measurement principle is used.
Mergers and acquisitions (M&A)
Mergers and acquisitions occur when one company gains control of another company. We collect this information separately from the FDI Survey and use it to produce our mergers and acquisitions involving UK companies quarterly statistical bulletins. The amount of M&A activity has been affected by the global COVID-19 pandemic, where the numbers of deals were much lower in April and May 2020 (Figure 3).
Figure 3: Number of completed mergers and acquisitions by month for inward, outward and domestic deals, January 2019 to September 2020
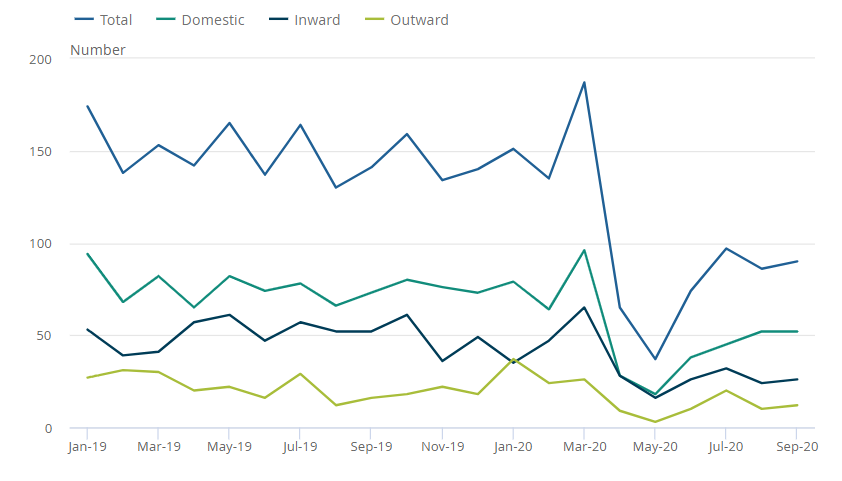
Source: Mergers and acquisitions involving UK companies – Mergers and Acquisitions Survey. For a more accessible version, please visit our accessibility policy.
The longer-term trends in M&A show that the value of inward M&A was relatively similar to that of outward M&A between 2010 and 2015. However, there were some very-high value inward acquisitions in 2016 and 2018 that made inward values much higher than outward in those years (Figure 4). More details of these deals can be found in previous editions of our mergers and acquisitions annual overview series.
Figure 4: Value of inward, outward and domestic mergers and acquisitions, 2010 to 2019
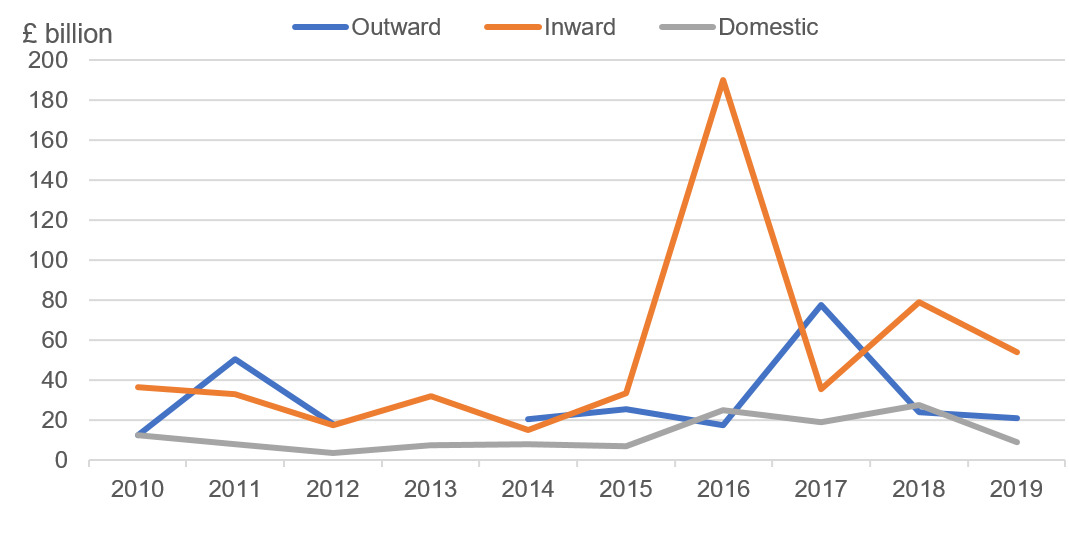
Source: Mergers and acquisitions involving UK companies – Mergers and Acquisitions Survey. For a more accessible version, please visit our accessibility policy.
Notes:
- Statistics for 2019 may have been revised since this chart was first produced in March 2020
- The value for outward M&A in 2013 is suppressed to mitigate disclosure
- A new method for compiling M&A statistics was introduced from Quarter 1 (January to March) 2018, which may lead to a structural break in all M&A statistical time series.
- Values of deals are in current prices and consequently do not account for the effects of inflation over time
Developments since September 2019 and forward plans
Alongside providing evidence for the inquiry, we wanted to take this opportunity to provide an update on our comprehensive transformation programme to develop FDI statistics that we initiated in April 2019, and progress made since we last wrote to the Committee in September 2019.
In that response, we referenced our guide to development and noted that our immediate priorities were to develop systems that will support the continuous improvement of FDI processes and related outputs. The short-term priorities included a review of the existing population frame, including the data sources that inform it, to ensure the FDI target population is representative, and to review the existing data collection process and results system.
Since the guide to development was published, we have procured a commercial dataset from Bureau van Dijk’s Orbis database. It provided further information on companies engaged in FDI relationships, alongside financial variable information. This dataset is being used to inform our population and sample design. The ONS has published experimental statistics on sub-national FDI using information from Orbis.
We have also considered options for compilation of greenfield estimates, including consideration of US Bureau for Economic Analysis (BEA) approach, and developed questions for FDI by type (greenfield, brownfield, other financial restructuring).
All other FDI data collection requirements have been reviewed, and we are implementing additional questions to our surveys, which will allow us to develop new, more granular FDI statistics and deliver against emerging user needs. These new questions will collect data on sub-national FDI, disinvestment and business characteristics of foreign affiliates. These new questions, including the FDI by type questions, will be included in the surveys dispatched from March 2021.
The ONS has continued to collaborate with our colleagues across Government to share our progress and development plans. We are also collaborating with the Department for International Trade (DIT) to determine the feasibility of sharing microdata to assess insights that the ‘top down’ and ‘bottom up’ approaches to FDI measurement.
In July 2019, the Committee’s report recommended that DIT commission a body to produce a comparison and synthesis of the various statistical data-sources on UK foreign direct investment. As such, in April 2020, a methods comparison of ONS and externally produced estimates of FDI was published, which summarised key differences between sources of information for inward FDI.
Once we start receiving new information from the FDI survey, we can explore dissemination plans going forward. This will depend on how much information we receive, any gaps in responses and then how long it takes to develop suitable methods to calculate early experimental statistics. Before then, we will look to publish an update to our FDI development plan later this year to provide further information.
While developing FDI statistics is inherently complex, the ONS has made good progress in providing more detail to current statistics and developing new statistics in emerging areas. This includes the FDI trends and analysis series, and continuing research on greenfield FDI and resident Special Purpose Entities (SPEs). We also have and continue to share our experiences and learn from discussions with international partners.