Dear Chair,
I write in response to the European Affairs Committee’s call for evidence for the inquiry, Trade in goods.
As the Committee may be aware, the Office for National Statistics (ONS) is the National Statistical Institute for the UK and the largest producer of official statistics. The ONS aims to provide a firm evidence base for sound decisions and develop the role of official statistics in democratic debate.
Disruption after the Transition Period
The ONS publishes monthly statistical bulletins that detail the total value of UK exports and imports of goods and services in current prices and chained volume measures, which means they are adjusted for inflation. The most recent analysis details trade in goods measured in August 2021. Analysis for September 2021 is due to be published mid-November; I would be happy to share this with the Committee.
Previously announced timings of the UK leaving the EU and the subsequent transition period, along with the impact of the coronavirus (COVID-19) pandemic, have caused higher levels of volatility in trade statistics in the past two years. While the monthly narrative provides continued analysis on the short-term disruption impacts, comparing 2021 with equivalent 2018 data provides comparisons of trade with our most recent “stable” period.
Figures 1 and 2 show that imports and exports of goods from non-EU countries continues to be higher than with EU countries, although the gap has narrowed. Table 1 shows a comparison of EU and non-EU trade in goods, in millions of GBP.
Figure 1: EU and non-EU goods imports, excluding precious metals, August 2018 to August 2021

Source: Office for National Statistics – UK trade statistics (current prices, seasonally adjusted) . For a more accessible version, please visit our accessibility policy.
Figure 2: EU and non-EU goods exports, excluding precious metals, August 2018 to August 2021
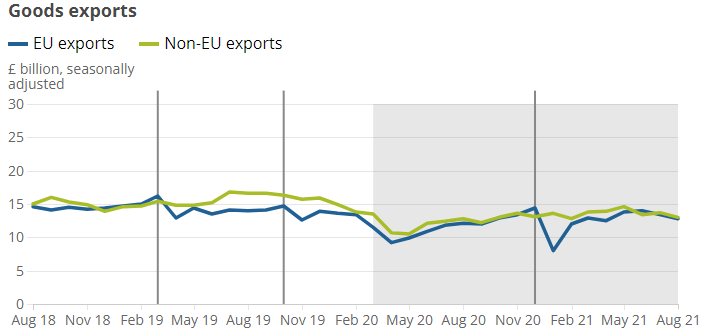
Source: Office for National Statistics – UK trade statistics (current prices, seasonally adjusted) . For a more accessible version, please visit our accessibility policy.
Table 1: Trade in goods, excluding precious metals, EU, and Non-EU comparison
| Direction | Period | EU, £m | Non-EU, £m | Monthly Comparison |
|---|---|---|---|---|
| Imports | 2021 Jan-Aug | 145 613 | 153 352 | Non-EU larger in 8 out of 8 months |
| Imports | 2020 | 232 382 | 196 186 | EU larger in 12 out of 12 months |
| Imports | 2019 | 269 568 | 224 896 | EU larger in 12 out of 12 months |
| Imports | 2018 | 267 210 | 221 642 | EU larger in 12 out of 12 months |
| Exports | 2021 Jan - Aug | 99 384 | 108 796 | Non-EU larger in 7 out of 8 months |
| Exports | 2020 | 145 098 | 152 595 | Non-EU larger in 11 out of 12 months |
| Exports | 2019 | 170 111 | 187 335 | Non-EU larger in 8 out of 12 months |
| Exports | 2018 | 172 505 | 176 684 | Non-EU larger in 9 out of 12 months |
Impact of Pandemic
With the ongoing pandemic and recession, it is difficult to assess the extent to which the patterns seen in the tables and charts above reflect short-term trade disruption or longer-term supply chain adjustments.
Businesses reporting that the end of the EU transition period was their main importing or exporting challenge increased between the end of December 2020 and April 2021, as shown in Figure 3.
In addition, Figure 4 shows the number of weekly cargo and tanker ship visits to UK ports in January 2021 was on average 20.4% lower than January 2020, reflecting disruption in trade. The number of visits has since increased and in April 2021 became higher than the same period in 2020, although that partly reflects coronavirus impacting on the 2020 numbers.
Figure 3: Percentage of currently trading businesses that have reported experiencing challenges, weighted by count, December 2020 to April 2021
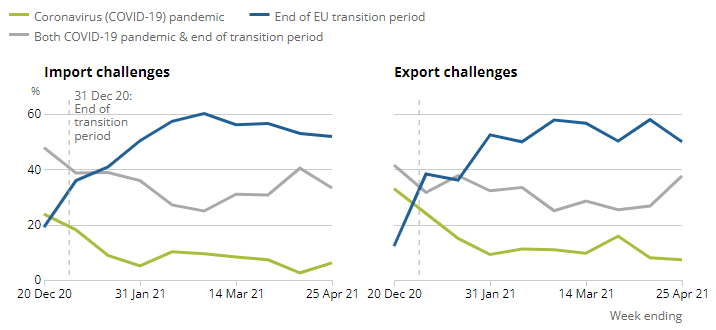
Source: Office for National Statistics – Business Insights and Conditions Survey. For a more accessible version, please visit our accessibility policy.
Figure 4: UK cargo and tanker weekly visits, seven-day moving average, seasonally adjusted

Source: exactEarth. For a more accessible version, please visit our accessibility policy.
Trading challenges – latest picture
In the two weeks to 3 October 2021, analysis of data from the Business Insights and Conditions Survey (BICS) showed that 40% of exporters and 49% of importers reported that costs of exporting and importing respectively had increased compared with normal expectations; 37% of exporters and 43% of importers reported that time spent exporting and importing respectively had increased compared with normal expectations for the time of year; and the top 3 challenges for both exporters and importers were additional paperwork, change in transportation costs and customs duties or levies.
Please do not hesitate to contact me if I can be of any further assistance to this inquiry.
Yours sincerely,
Grant Fitzner
Director, Macroeconomic Statistics and Analysis