Dear Mr Stride,
I write in response to the Treasury Committee’s call for evidence for its inquiry into ‘An Equal Recovery’.
As the Committee will be aware, the Office for National Statistics (ONS) is the UK’s National Statistical Institute and the largest producer of official statistics. The ONS aims to provide a firm evidence base for sound decisions and develop the role of official statistics in democratic debate.
Our submission focuses on the following questions in the terms of reference:
- What are recent trends in income and wealth inequality in the face of the pandemic?
- What are the trends in intergenerational inequality, and how has the crisis affected them?
- How has the economic impact of the crisis affected disability, gender, and race inequality?
- How has the crisis impacted on regional inequality?
- Are certain regions or sectors likely to recover more slowly or have longer term economic damage and greater scarring?
I hope this is useful to the Committee, and please do let me know if we can follow-up on any further specific questions for this inquiry.
Yours sincerely,
Jonathan Athow Deputy National Statistician and Director General, Economic Statistics, Office for National Statistics
Office for National Statistics written evidence: An Equal Recovery, July 2021
Summary
Overall, the COVID-19 pandemic has affected the economy in a variety of ways, which has translated into differing effects on the population. The Office for National Statistics (ONS) has reacted to user demand and published analysis throughout the pandemic which illustrates that:
- Throughout the pandemic, those at the lower end of the income distribution were more likely to have felt negative financial impacts.
- Households of younger people were less likely to be able to sustain levels of spending and the 18 to 24 years age-group had the highest proportion of those who spend more than their income.
- This translated into significant differences between the financial effects on young and older people during the pandemic: older people (60 and over) were significantly more likely to say they expected the financial situation of their household to stay the same during the next 12 months from April/May 2020.
- In addition, in the labour market, young people’s (16-24) employment rate saw a very large decline in 2020 compared with 2019 and relative to other age groups.
- The pandemic negatively impacted the wellbeing of disabled people, with some financial impacts worse as well.
- Women and men had different experiences of the pandemic too, though there were differences between the formal labour market and wider household activities. While the employment rate for men fell more than for women, women continued to deliver the most childcare, and were more likely to report worse personal well-being impacts.
- Early on in the pandemic we published analysis that showed that over a quarter (27%) of Black, African, Caribbean or Black British ethnic groups reported finding it difficult to get by financially, significantly more than any other ethnic group.
- Using quarterly regional GDP, we saw London and the East of England impacted more than other regions and nations due in part to their reliance on services industries in Quarter 2 and 3 of 2020 (the latest data available).
- The travel and tourism and hospitality sectors were especially affected by the pandemic, and we published specific analysis looking at various linked impacts.
The following evidence submission picks up on these points in greater detail.
Moreover, as highlighted throughout this submission, the ONS are using new surveys and administrative data to provide the best evidence to understand the impact of COVID-19 on the economy and society, and to track the UK’s recovery from the pandemic. We continue to work to address the gaps in the data that remain whilst improving the granularity and timeliness of analysis we produce. We are working across Government to do so, including bringing together administrative data using the Integrated Data System as a key enabler. We will also look to seek funding to improve our survey portfolio where appropriate.
What are recent trends in income and wealth inequality in the face of the pandemic?
Early in the COVID-19 pandemic, the Office for National Statistics (ONS) set up the Opinions and Lifestyle Survey (OPN), which was created to understand the impact of the pandemic on society. This complemented our regular statistics bringing together personal (subjective) and economic well-being. The latest data was published on May 2021.
These statistics illustrates that throughout the pandemic those at the lower end of the income distribution were more likely to have felt a loss of income than those at the top end of the income distribution, as well as other negative financial impacts, such as being more likely to need to use savings to cover living costs, not being able to save for the year ahead, and having to borrow money due to COVID-19.
Using Quarterly Labour Force Survey and Longitudinal Labour Force Survey data with a focus on 2020 and up to March 2021 we can also see the impact on young people (those aged 16-24 years) in the labour market has been notable when compared with other age groups.
Young people’s employment rate saw a large decline in 2020 compared with 2019, while their unemployment and economic inactivity rates increased. After an initial fall in young people in full-time education in the first few months of the pandemic, the proportion of young people in full-time education increased in the second half of 2020, reaching a new high of 47.2% in Quarter 3 (July to Sept) 2020 and remaining high since, with the challenging labour market likely to be a contributing factor.
The number of young people employed in the accommodation and food services industry who moved to unemployment or economic inactivity increased by more than 50% in Quarter 2 (April to June) 2020 compared with Quarter 2 2019. Young people who worked part-time moved from employment to economic inactivity at a faster rate than they moved to unemployment in 2020, so in short, more likely to stop looking for work. Moreover, their labour mobility (job-to-job moves) also declined more during the pandemic than for older age groups.
What are the trends in intergenerational inequality, and how has the crisis affected them?
We looked at the social impacts of coronavirus on younger people (aged 16 to 29) and older people (aged 60 and over) at the start of the pandemic (3 April to 10 May 2020). While young people were mainly worried about the impact of coronavirus on their education, work and household finances, among older people, their main concerns were around being unable to make plans in general and personal travel plans such as holidays.
A significantly higher proportion of young people (30%) reported that the coronavirus was affecting their household finances, than older people (13%), with 84% of young people who had reported this, saying they had experienced a reduction in income and 38% saying they were unable to save. The proportion of 16 to 29-year-olds reporting these impacts were significantly higher than for those aged 60 years and over. Older people were also significantly more likely to say that they expected the financial situation of their household to stay the same over the next 12 months than younger people; 56% of those aged 60 years and over expressed this compared with only 40% of those aged 16 to 29.
As may be expected when comparing with older people, many of whom are retired, younger people were also significantly more likely to report that the pandemic had affected their work, with 21% of those aged 16 to 29 who reported this saying they had experienced a reduction in hours worked. Data from other sources for the period leading up to the pandemic also showed that young people were the most likely to report their working arrangement as a zero-hours contract.
How has the economic impact of the crisis affected disability, gender, and race inequality?
Disability
Before the pandemic, between April 2018 to March 2020, younger people and those who were unemployed, or sick and disabled, were more likely to report that they (a) would not be able to make ends meet for one week without their main source of income, (b) regularly run out of money before the end of the week/month and (c) would not be able to find money to cover a large, unexpected expense.
During the pandemic, disabled people have been more likely to report worse personal well-being impacts, such as being stressed or anxious, worsening mental health, and feeling worried about the future. They have been less able to work from home, and while they were as likely to report having reduced household income than those without a disability, their financial impacts have been worse in some respects, such as being more likely to report borrowing money due to COVID-19, using savings to cover living costs and not being able to save for the year ahead.
In the first quarter of the pandemic, employment rates of people with disabilities fell a little more sharply than for those without disabilities, with a more pronounced increase in economic inactivity, however they have also recovered more since those early days.
Gender
We published a release looking at the different effects of the pandemic on men and women in the UK from March 2020 to February 2021. For example, women were more slightly likely than men to be furloughed: 2.91m to 2.72m for men on 1 July 2020. Over time, the difference decreased, with preliminary data suggesting that on 31 December 1.88m women and 1.85m men were furloughed.
In the labour market, the employment rate for men aged 16 to 64 fell 2.7 percentage points between the three months ending February 2020 and its lowest point during the pandemic, but has recovered slightly to 2.4 percentage points below by the three months ending May 2021. Meanwhile the rate for women fell to 1.2 percentage points below its pre-pandemic level, before recovering to 1.1. percentage points below. This may be largely due to the bigger effect of the pandemic on the self-employed, which has a higher representation from men, and the lower impact on public administration, education and health during the pandemic, which have higher representation from women.
The effects of the pandemic were, however, much wider than just the formal labour market. A greater proportion of women (67%) than men (52%) home-schooled a school-age child in their home in late January and early February 2021, and a greater proportion of women reported that home schooling was affecting their well-being than men (34% compared with 20% for men) during the first lockdown (April and early May 2020). By late January and early February 2021, it was taking a greater toll on both women (53%) and men (45%).
We also looked specifically at parenting in lockdown and the effects of this on work life balance, which illustrates a gendered impact. In the first lockdown, men took on a larger share of the childcare than previously, but women were still delivering an average of 3 hours and 18 minutes of childcare, which includes time spent supervising children, while men contributed 2 hours.
The shares were more evenly split between men and women for developmental childcare such as reading to children or helping them with their homework and home-schooling. However, women picked up a much larger share of ‘non-developmental’ time, such as washing, feeding and dressing children and supervision of children. This is reflected particularly for parents of children under 5, where we see the biggest difference in time spent on childcare with women spending 4 hours 25 minutes on average while men spent 2 hours 29 minutes on it on average per day.
Overall, women have been more likely to report worse personal well-being impacts such as being stressed or anxious, the pandemic making their mental health worse, and feeling worried about the future. Women’s financial impacts have been worse in some respects, such as being more likely to report borrowing money due to COVID-19, using savings to cover living costs and not being able to save for the year ahead. While men were slightly more likely to say they were not able to save as usual, women were as likely to report having reduced household income as men.
Ethnicity
We used the UK Household Longitudinal Study to look at the impacts of coronavirus on different ethnic groups in the early part (April 2020) of the pandemic, finding that over a quarter (27%) of those from Black, African, Caribbean or Black British ethnic groups reported finding it very or quite difficult to get by financially, significantly more than those from White Irish (6%), Other White (7%), Indian (8%) and Pakistani or Bangladeshi (13%) ethnic groups. A quarter of people (25%) from Black, African, Caribbean or Black British ethnic groups reported being behind on bills and 22% reported being less able to keep up with housing payments, with significantly higher proportions reporting struggling in these ways than respondents in other ethnic groups.
Looking at the labour market by ethnic group, the picture is not clear, with groups performing better or worse than others on different metrics.
How has the crisis impacted on regional inequality?
The latest release of quarterly regional GDP is for Quarter 3 (July to Sep) 2020 and is compiled mainly from administrative data sources, principally HMRC’s VAT turnover data. Lags in the data arising from the reporting requirements on businesses means the timeliness of our regional GDP is two quarters behind the first estimate of GDP.
To give context, in Quarter 2 2020, out of the 9 English regions and Wales, the East of England saw the largest fall (-21.1%) and Wales saw the smallest fall (-15.2%). Of the 9 English regions London saw the smallest fall (-17.2%) but provided the largest contribution to the UK fall.
In the East of England, for Quarter 2 2020, the services industries provided the largest contribution to the fall (–18.1%). Within this main sector, we can break this down by the wholesale and retail (-19.8%), accommodation and food services (-75.7%) and education (-30.4%). In addition, manufacturing (-27%) and construction (-42.7%) fell. By Quarter 3, all these industries bounced back from the fall apart from manufacturing (23.6%) and education (20.3%). Four of the 14 services industries recovered the growth lost in Q2 2020.
In Wales, for Quarter 2 2020, the largest falls were seen in manufacturing (-15.2%), accommodation (-76.3%), wholesale and retail (-17.8%) and construction (-32.7%). By Quarter 3, all these industries bounced back from the fall apart from construction, with a rise of 30.9%. In London, for Quarter 2 2020, total services fell by 16%, with the largest contribution to the fall from accommodation and food services (-75.8%), administrative support services (-31%) and transport and storage (-38.1%).
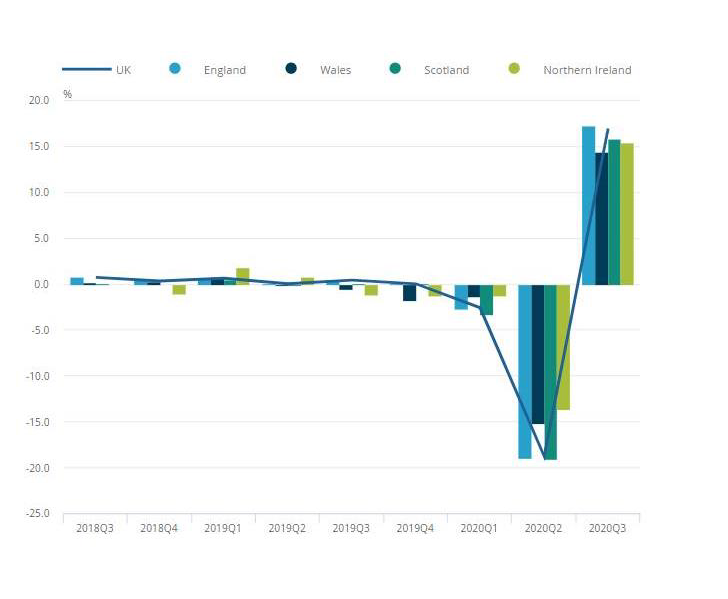
Figure 1 shows GDP growth for the UK and its countries from Quarter 3 (July to Sept) 2018 to Quarter 3 (July to Sept) 2020.
Figure 1: All four countries in the UK had positive growth for Quarter 3 (July to Sept) 2020
Seasonally adjusted quarter on quarter GDP growth for the UK and its countries, Quarter 3 (July to Sept) 2018 to Quarter 3 (July to Sept) 2020
In Quarter 3 2020, the services industry has not fully rebounded, with a rise of 11.7% and only six of the 14 sub-industries recovering from their fall in growth in Quarter 2 2020. The transport and storage; arts, entertainment and recreation, and administrative and support service activities and education show the weakest recovery in growth following their decline in Quarter 2 2020. London experienced the largest fall in financial services out of all UK regions in Quarter 2 2020, with a fall of 8.8% although rebounded a little with growth of 3.2% in Quarter 3 2020.
In Quarter 3 2020, only three of the English regions recovered the growth lost in Quarter 2 2020: Yorkshire & Humber, East Midlands and the South West. For all three regions, accommodation and food services provided the largest contribution to the growth along with wholesale and retail, manufacturing and construction.
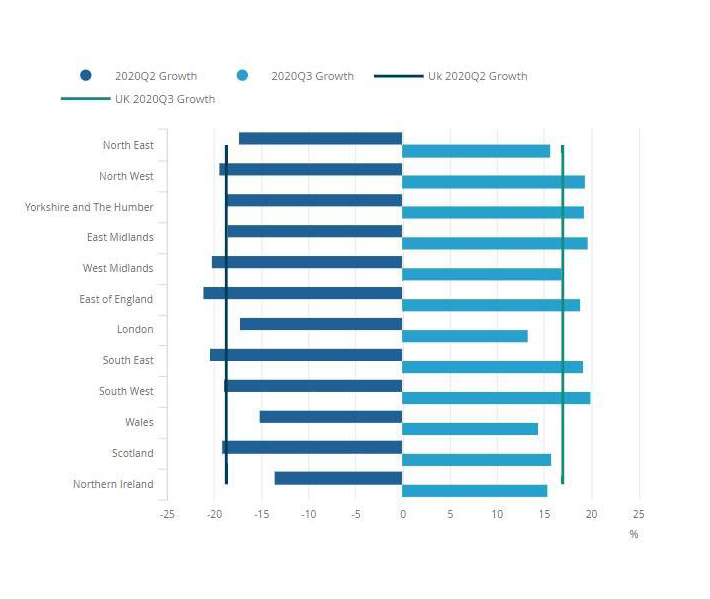
The regions that saw the smallest recovery in Quarter 3 2020 were London (13.3%) and West Midlands (16.8%). In the West Midlands for Quarter 3 2020, manufacturing has not recovered from the fall in Quarter 2, and only four of the fourteen services industries have recovered in growth. Figure 2 shows quarter on quarter growth for the regions of England and countries of the UK for Quarter 2 (Apr to June) 2020 and Quarter 3 (July to Sept) 2020.
Figure 2: The region with the largest positive GDP growth in Quarter 3 (July to Sept) 2020 was the South West which increased by 19.9%
Seasonally adjusted quarter on quarter GDP growth for the regions of England and countries of the UK for Quarter 2 (Apr to June) 2020 and Quarter 3 (July to Sept) 2020
Are certain regions or sectors likely to recover more slowly or have longer term economic damage and greater scarring?
Another survey set up at the beginning of the pandemic was the Business Insights and Conditions Survey (BICS), which helps us understand business impacts at the national and sub-national level on the UK economy. Using microdata from this survey we can understand the business impacts of local and national restrictions.
For example, we can see that multi-site businesses (tend to be larger companies) have a consistently higher proportion of businesses currently trading than single-site businesses (smaller companies) from November 2020 to July 2021, though the gap is narrowing. Meanwhile, the percentage of businesses experiencing a decrease in turnover is similar for both single-site and multi-site businesses with both seeing a steady improvement over time.
Wales had the highest percentage of single-site businesses currently trading in early July 2021, at 98%. And Scotland has consistently had the highest proportion of its workforce on furlough leave since early November 2020, but is now at similar level to both England and Wales.
Based on information from HM Revenue and Customs Real Time Information on the number of payroll employees, in June 2021 four regions were above pre-pandemic levels: North East, North West, East Midlands and Northern Ireland. Most other regions were within around 1% of pre-pandemic levels. The exception was London, which fell by a higher percentage than other regions and still had over 3% fewer payroll employees in June than pre-pandemic.
We have also looked at particular sectors that have been heavily impacted by the pandemic, such as hospitality (published July 2021) and travel and tourism (published February 2021). For example, these highlighted the uneven impact on hospitality, and lack of confidence in business survival compared to the all sector level. Job vacancies in the hospitality sector have seen large increases and are higher than pre-pandemic levels; however, in June 2021, the number of employees within the sector remained 11% below February 2020 levels.
For travel and tourism, the impact was immediate: monthly air passenger arrivals to the UK fell from 6,804,900 in February 2020 to 112,300 in April 2020, a fall of 98.3%. It had a regional impact, as Greater London saw the largest fall in room occupancy of any English region from 2019 to 2020, with just 20% of rooms occupied in July 2020 compared with 90% in the same month in 2019. In the three months to June 2020, employment in accommodation for visitors fell by 21.5% compared with the same three months of 2019.
Accommodation and travel agency businesses saw the sharpest decline in turnover during the first national lockdown, falling to 9.3% of their February levels in May 2020. In travel and tourism industries overall, the number of people aged 16 to 24 years saw the largest fall in employment of any age group between Quarter 3 (July to Sept) 2019 and Quarter 3 2020.
Office for National Statistics
July 2021