Dear Ms Morgan,
I write in response to the Treasury Committee’s call for evidence for its inquiry into economic crime.
As the Committee may be aware, the Office for National Statistics (ONS) is the UK’s National Statistical Institute, and largest producer of official statistics. We aim to provide a firm evidence base for sound decisions, and develop the role of official statistics in democratic debate.
ONS has collected information on the extent and nature of economic crime and how it affects consumers since 2012, having taken responsibility from the Home Office. In the years following, significant progress has been made in developing the evidence base on fraud.
The attached note presents evidence to the Committee’s inquiry, with information on the scale of different forms of fraud, trends in fraud, the extent of financial loss to individuals, and the emotional impact on the victims of fraud.
While we have offered evidence according to the scope of the Committee’s inquiry, we would be happy to provide additional information as required.
Yours sincerely,
Iain Bell
Deputy National Statistician and Director General for Population and Public Policy
Office for National Statistics
Introduction
The Office for National Statistics (ONS) publishes statistics on fraud, mainly based on the Crime Survey for England and Wales (CSEW), a victimisation survey of the resident population which is used to measure the extent and nature of crime and was expanded to cover fraud offences in 2015.
Statistics from this new element of the CSEW have added a great deal to our understanding of fraud in England and Wales and these new figures form the basis of the evidence presented in this paper. Evidence presented includes information on the scale of different forms of fraud, the extent of financial loss to individuals, as well as the emotional impact of fraud. CSEW estimates have enabled us to produce the first reliable estimates of this kind. However, it is important to note that evidence in this area is based on an emerging picture. With only two years of new survey data available it is not yet possible to make reliable assessments of trends over time. Over the course of time and as more CSEW data become available, the CSEW will provide the best measure of trends in fraud in England and Wales.
ONS has also expanded its use of other data sources to help build a fuller picture of the extent and nature of fraud. The official statistics include information on crimes reported to the authorities as well as offences referred to industry bodies representing businesses and other organisations. In particular, these sources can help provide some insights into trends in fraud.
Data sources and what they cover
There are three main sources of data used in ONS statistics on fraud:
- The CSEW; a large household survey collecting information on crimes directly affecting the resident adult population of England and Wales;
- National Fraud Intelligence Bureau (NFIB) data on the number of incidents of fraud referred to them by Action Fraud (the national fraud and cybercrime reporting centre). This also includes referrals of fraud incidents by two industry bodies, Cifas and Financial Fraud Action UK (FFA UK, a constituent part of UK Finance), who report instances of fraud where their member organisations have been a victim; and
- Bank and credit account fraud data from UK Finance; these include crimes not referred to the NFIB and provides an important insight into trends in these types of fraud.
The CSEW encompasses a broad range of frauds, including attempts as well as completed offences involving a loss; Annex A gives further information on the types of fraud covered by the survey. One of the main strengths of the CSEW is that it captures incidents that are not reported to the authorities. Unlike administrative sources it is not affected by changes in recording practices or reporting rates to official bodies.
The CSEW is a household survey and does not cover crimes against businesses. Given the emphasis of the Committee’s inquiry on consumer fraud, the CSEW provides the most appropriate measure. It is also important to note when interpreting the figures that the survey counts the individual as a victim, even in incidents where they have been fully reimbursed (e.g. by their bank).
Incidents of fraud referred to the NFIB by Action Fraud, Cifas and UK Finance will include reports from businesses and other organisations as well as members of the public. They will also tend to mostly be focused on cases at the more serious end of the spectrum. This is because, by definition, they will only include crimes that the victim considers serious enough to report to the authorities or where there are viable lines of investigation.
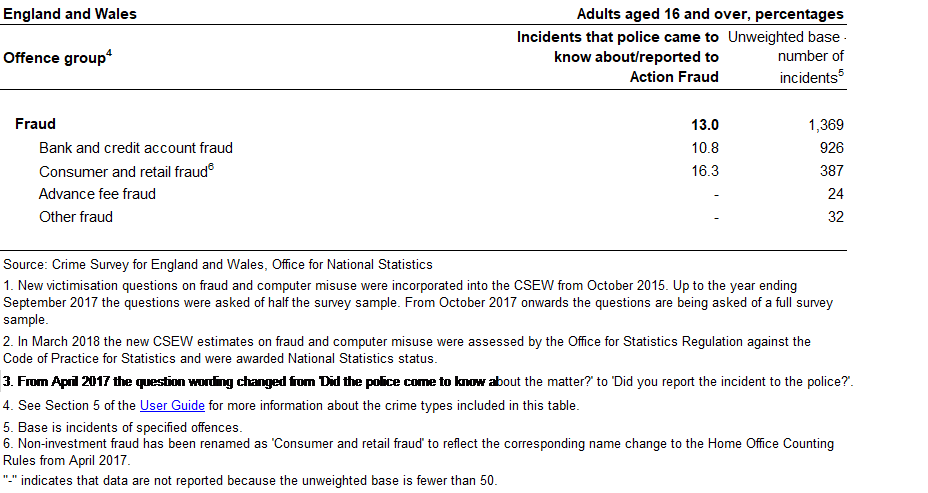
Findings from the CSEW indicate that only a relatively small proportion of fraud incidents (including those where a loss was suffered) either came to the attention of the police or were reported to Action Fraud: 13% of incidents in the year ending June CSEW. Further detail can be found at Annex B – Table A1. This low reporting rate means that NFIB recorded fraud data provide only a partial picture of the extent of fraud, however they do provide a good measure of more serious fraud offences, where the financial loss to the victim is greater, as reporting rates for these offences tend to be higher.
Due to these limitations this evidence paper does not include NFIB data on recorded fraud; these data are summarised in the latest ONS crime statistics bulletin. Most of the figures used in this paper are sourced from the CSEW as the survey provides the best indication of the volume of fraud offences directly experienced by individuals in England and Wales.
Estimates of the scale of fraud
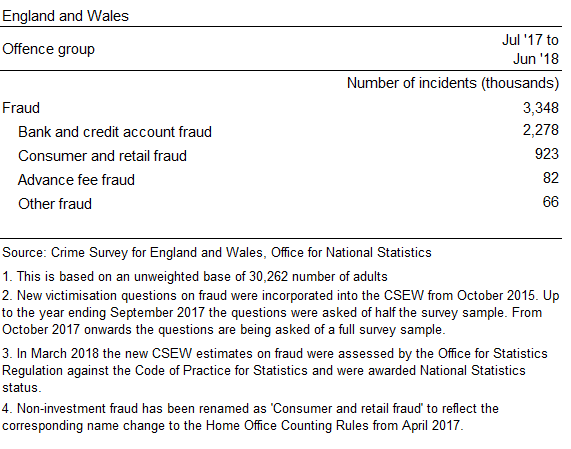
The latest published finding from the CSEW refer to the survey year ending June 2018. These figures show an estimated 3.3 million fraud incidents experienced by adults in England and Wales. Table 1 shows these latest estimates broken down into separate offence groups.
Table 1. Estimated number of incidents of fraud, year ending June 2018 CSEW
Around two-thirds (68%) of incidents were bank and credit account fraud which usually involve falsely obtaining or using personal bank or payment card details to carry out fraudulent transactions. Consumer and retail fraud was the next most commonly occurring form of fraud; this includes crimes such as fraudulent sales, bogus callers, ticketing fraud and computer software service fraud.
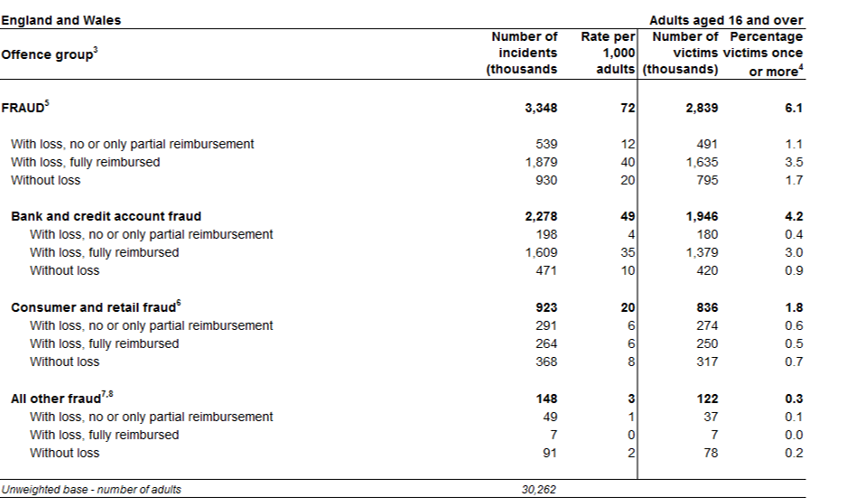
These estimates show that fraud offences are among the most prevalent crimes in England and Wales (Table 2). For example, adults were five times more likely to be a victim of bank and credit account fraud than theft from the person (i.e. pickpocketing or theft of items being carried on the person).
Table 2: Fraud by loss (of money or property) – number and rate of incidents and number and percentage of victims, year ending June 2018 CSEW
The nature of fraud
The CSEW also provides information on the nature of fraud incidents. Almost three-quarters of fraud incidents involved loss of money or goods to the victim (72%), independent of any reimbursement received; this equates to an estimated 2.4 million offences, compared with 0.9 million incidents of fraud involving no loss. The proportion of incidents resulting in loss varied by type of fraud, with 79% of bank and credit account fraud victims experiencing loss compared with 60% of consumer and retail fraud victims. However, the large majority of bank and credit account victims received full reimbursement for their loss, while reimbursement was less common in cases of consumer and retail fraud where less than half of those of experiencing loss were fully reimbursed (Table 2).
Where money was taken from victims of fraud, in over a third (38%) of incidents the victim lost less than £100 and in over half (58%) of incidents the loss was less than £250. CSEW estimates indicate that losses of larger amounts of money were comparatively rare. For example, in 7% of incidents involving loss, the amount was greater than £1000 (Table 3).
Table 3: Financial loss suffered by victims of fraud, year ending June 2018 CSEW
New data have been released by UK Finance on Authorised Push Payment (APP) scams, which involve cases where victims are tricked into sending money directly from their account to an account which the fraudster controls. APP fraud will sometimes involve substantial loss to the victim and, unlike other frauds, victims are often deemed to have been at fault and are less likely to recover their losses. The new data show that in the year ending June 2018, there were 58,633 cases of APP fraud reported to UK Finance.
APP fraud can often involve significant sums of money and have adverse financial and emotional consequences for the victim. Unlike most other frauds, victims of APP fraud authorise the payment themselves and this means that they have no legal protection to cover them for losses. UK Finance reported that £145.4 million was lost through such scams in the first six months of 2018. The majority of victims (92%) lost savings on personal accounts, losing an average of approximately £2,950 and the remainder were businesses, who lost on average approximately £20,000 per case.
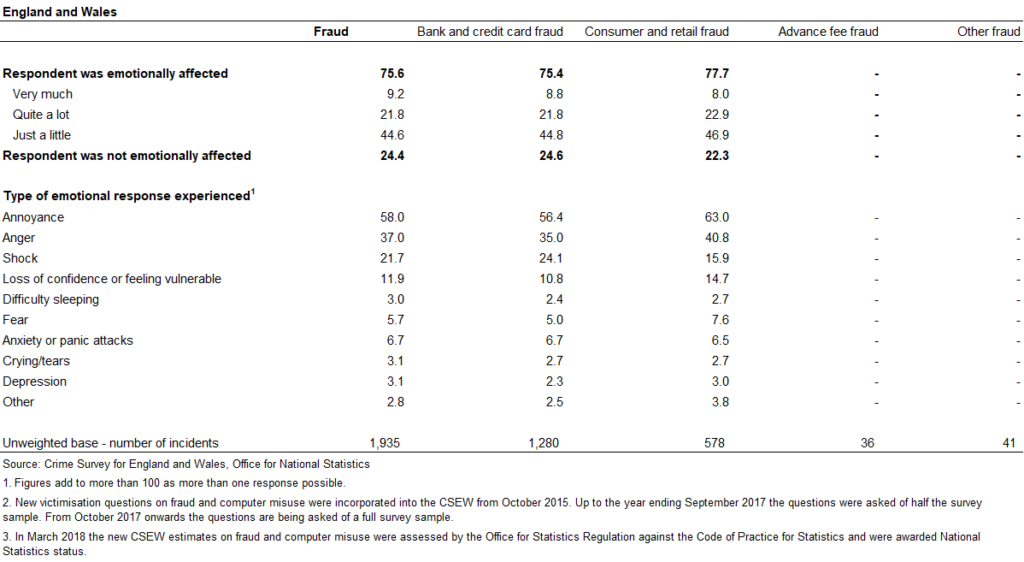
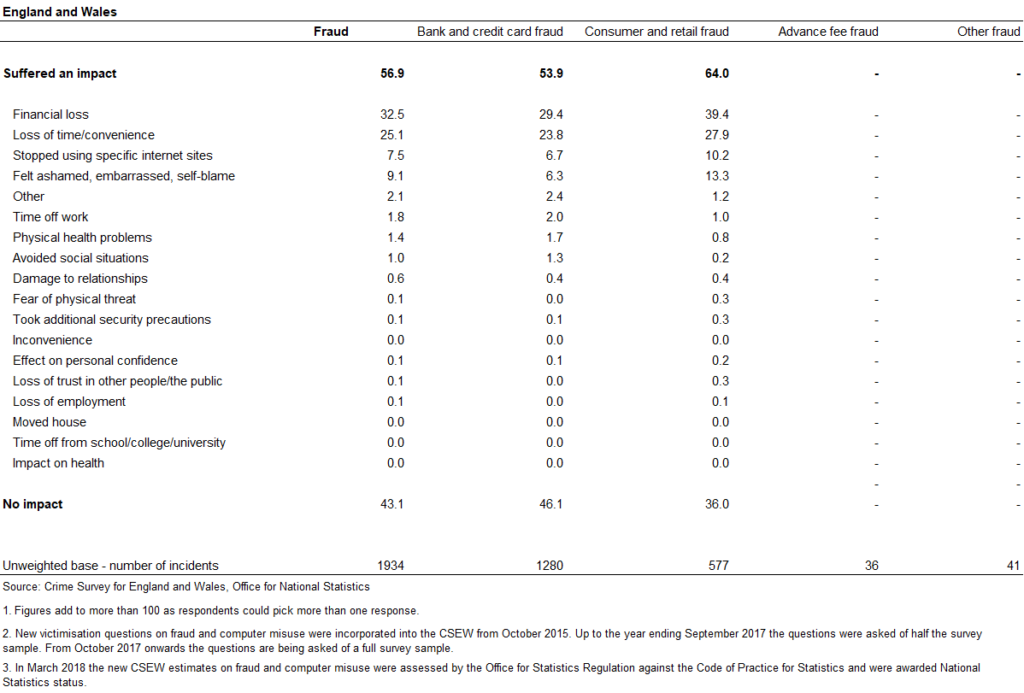
The CSEW also collects further data on the emotional impact of fraud victimisation more generally. Tables showing the latest estimates are presented in Annex B (Tables A2 and A3). The majority (76%) of victims were emotionally affected by the fraud. Common with other types of acquisitive crime the most common emotional reactions were annoyance, anger and shock.
Trends in fraud
There are limited data sources that give us information of how the extent and nature of fraud has changed over time. As the CSEW has only included estimates of fraud for the last two years it does not yet provide a reliable picture of trends. Our latest statistical bulletin includes comparisons of the latest year with the previous year which show that overall levels of fraud have remained at similar levels over this period, while consumer and retail fraud showed a rise. However, it is important to keep in mind that these comparisons between two data point provide limited insight into trends. As more data are compiled the CSEW will provide more robust trend data.
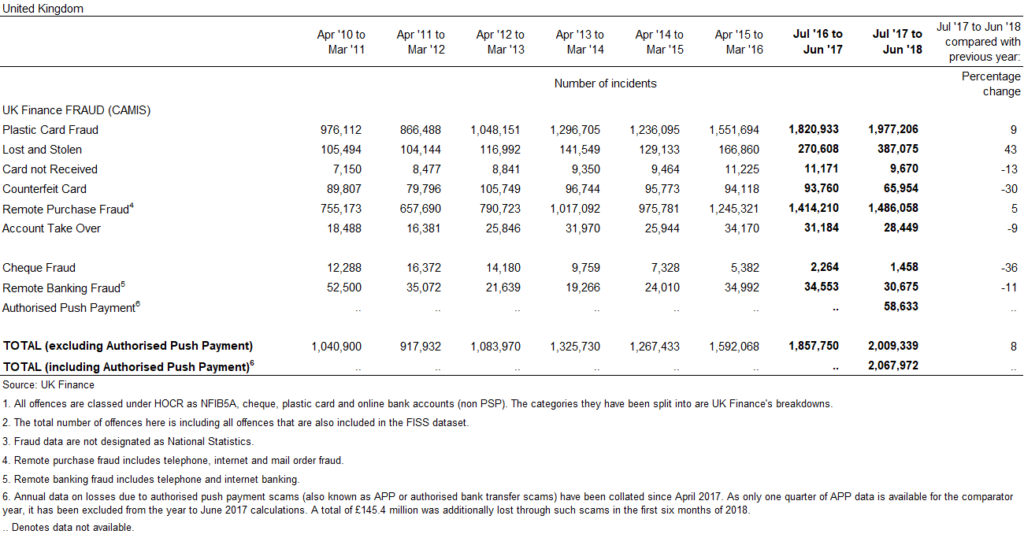
Other sources of data do provide some insights into trends, particularly in banking and credit account fraud. While data on frauds referred to the NFIB provide only give a partial picture (and provide a valuable source of reported fraud and demands placed on the police), separate data collated by UK Finance (via their CAMIS system) provide a broader range of bank account and plastic card frauds. These data include card fraud not reported to the police for investigation. They therefore offer a better picture of the scale of bank account and plastic card fraud identified by financial institutions in the UK, and can give a valuable indication of trends in these types of crime.
In comparison with offences reported to the NFIB, most of the additional offences covered in this broader UK Finance dataset fall into the category of remote purchase fraud (where card details have been fraudulently obtained and used to undertake fraudulent purchases over the internet, phone or by mail order) and fraudulent incidents involving lost or stolen cards. Collectively these account for a high proportion of plastic card fraud not included in the NFIB figures.
In the year ending June 2018, UK Finance data showed 2.0 million cases of frauds (excluding Authorised Push Payments) involving UK-issued payment cards, remote banking and cheques. This is an increase of 8% from the previous year, accounted for solely by a rise in plastic card fraud. Over the eight years for which these data have been available the general trend indicates a rise in payment card and banking fraud reported to UK Finance (Figure 1).
The introduction of chip card technology has forced fraudsters to change their methods of working. These UK Finance figures also indicate that remote purchase fraud has consistently accounted for around three-quarters of all plastic card fraud reported to them. However, most of the latest increase in plastic card fraud reported via CAMIS was covered by offences falling into the category of “lost or stolen cards”, which rose by 43% from the previous year (to 387,075 offences).
This increase in lost and stolen card fraud reported to UK Finance is thought to be related to a rise in distraction thefts, where fraudsters are stealing cards in shops and at cash machines, and courier scams, where victims are tricked into handing over their cards on the doorstep. Further information on trends in payment industry fraud based on industry data collated by UK Finance is available in Fraud the Facts 2018.
Figure 1: CAMIS data indicate an increase in plastic card fraud reported to UK Finance over recent years. UK, year ending March 2011 to year ending June 2018
Office for National Statistics, November 2018
Annex A – CSEW Fraud categories
Bank and credit account fraud: Comprises fraudulent access to bank, building society or credit card accounts or fraudulent use of plastic card details.
Advance fee fraud: Comprises incidents where the respondent has received a communication soliciting money, mainly for a variety of emotive reasons, for example, lottery scams, romance fraud and inheritance fraud.
Consumer and retail fraud: Comprises cases where the respondent has generally engaged with the fraudster in some way, usually to make a purchase that is subsequently found to be fraudulent, for example, online shopping, bogus callers, ticketing fraud, phone scams and computer software service fraud.
Other fraud: Comprises all other types of fraud against individuals not recorded elsewhere, for example, investment fraud or charity fraud.
Annex B: Additional data tables
Table A1: Percentage of incidents of fraud and computer misuse reported to the police or Action Fraud, year ending June 2018 CSEW
Table A2: Emotional impact of incidents of fraud, year ending June 2018 CSEW
Table A3: Other impacts of incidents of fraud, year ending June 2018 CSEW
Table A4: Volume of fraud incidents on all payment types, UK Finance CAMIS database, year ending March 2011 to year ending June 2018, and percentage change

