Dear Mr Timms,
I write in response to the Work and Pensions Committee’s call for evidence for its inquiry on the disability employment gap.
As the Committee will be aware, the Office for National Statistics (ONS) is the UK’s National Statistical Institute, and largest producer of official statistics. We aim to provide a firm evidence base for decision makers and develop the role of official statistics in democratic debate. To do this during the coronavirus (COVID-19) pandemic, we are regularly publishing detailed commentary on, and analysis of, the impacts of COVID-19 on the UK economy and society. Alongside our regular publications, a suite of COVID-19 related statistics is now available on the ONS website. These include faster indicators, social impacts and economic impacts.
We have focused our evidence on the analysis being published on the labour market status of disabled people, with estimates from the Labour Force Survey, a survey of households. For the purposes of this analysis, a person is considered to have a disability if they have a self-reported long-standing illness, condition or impairment, which causes difficulties with day-to-day activities.
As the ONS continues to publish analysis of the impact of COVID-19 on businesses and workers, we would be happy to keep the Committee informed. Please do not hesitate to contact me if I can be of any further assistance.
Yours sincerely,
Jonathan Athow
Deputy National Statistician and Director General, Economic Statistics
Office for National Statistics
Office for National Statistics written evidence: Disability Employment Gap Inquiry
The Government Statistical Service Harmonised Standards focus on a ‘core’ definition of people whose condition currently limits their activity. In summary the core definition covers people who report:
- (current) physical or mental health condition(s) or illnesses lasting or expected to last 12 months or more; and
- the condition(s) or illness(es) reduce their ability to carry out day-to-day activities.
For the purposes of this analysis, people who meet these conditions are defined as disabled and those that do not meet these conditions are defined as non-disabled.
Please note that, due to the COVID-19 pandemic, all face-to-face interviewing for the Labour Force Survey (LFS) was suspended and replaced with telephone interviewing. This change in mode for first interviews has changed the non-response bias of the survey, affecting interviews from March 2020 onwards. Due to the impact on the non-response bias of the change to survey mode resulting from the pandemic, estimates from March should be treated with some caution.
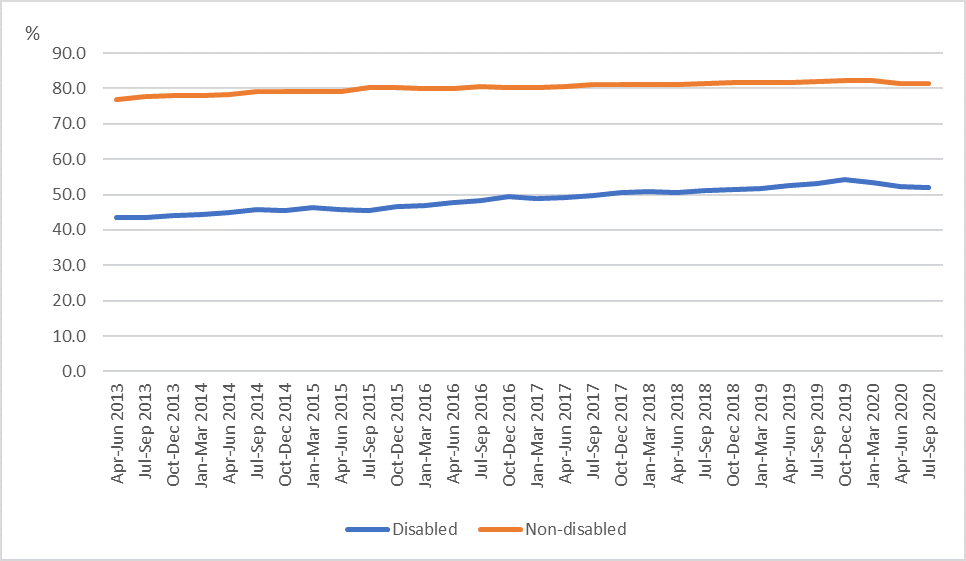
The LFS data show that disabled people were around a third less likely to be employed than non-disabled people, with an employment rate for disabled people (aged 16 to 64 years) of 52.1% in July to September 2020, compared with 81.3% for non-disabled people.
Figure 1: Employment rates for disabled and non-disabled people aged 16-64, UK, not-seasonally adjusted, April to June 2013 to July to September 2020
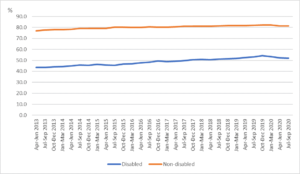
Source: Office for National Statistics – Labour Force Survey. For a more accessible version, please visit our accessibility policy.
The difference in the employment rate between disabled and non-disabled people had reduced from 33.1 percentage points in April to June 2013 to 28.1 percentage points in October to December 2019; however, there has been a slight widening of the gap again to 29.2 percentage points in July to September 2020.
The reduction in the gap was driven by a faster increase in the employment rate for disabled people, by 10.5 percentage points over the period April to June 2013 to October to December 2019, compared with non-disabled people, where the employment rate increased by only 5.4 percentage points during the same period. However, the employment rate has also fallen at a faster rate for disabled people compared with non-disabled people since the end of 2019: a drop of 2.1 percentage points compared with a drop of 0.9 percentage points.
An estimated 4.3 million disabled people were employed in July to September 2020; an increase of 1.4 million (47.6%) from April to June 2013, where the number of employed was 2.9 million. In contrast, the number of non-disabled people in employment increased more slowly, by 1.0 million (4.0%) during the same period.
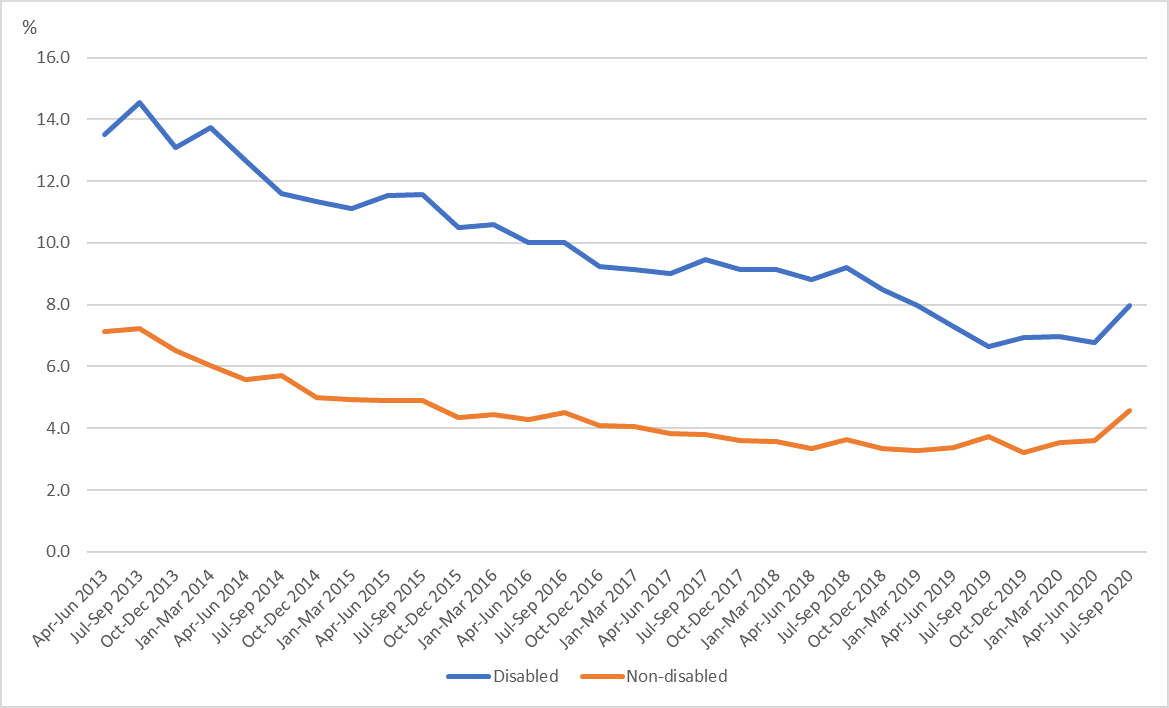
The unemployment rate (calculated as a proportion of the economically active population) for disabled people has been around twice that of non-disabled people since April to June 2013.
Figure 2: Unemployment rates for disabled and non-disabled people, aged 16-64, UK, not-seasonally adjusted, April to June 2013 to July to September 2020
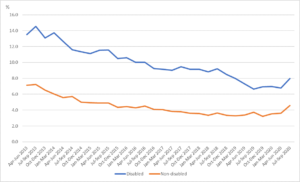
Source: Office for National Statistics – Labour Force Survey. For a more accessible version, please visit our accessibility policy.
The unemployment rate roughly halved for both disabled people and non-disabled people between April to June 2013 and October to December 2019; however there has been an increase in the unemployment rate for both groups since the beginning of 2020.
Although the number of economically inactive disabled people has increased since April to June 2013, the economic inactivity rate has decreased faster for disabled people than non-disabled people; decreasing from 49.5% in April to June 2013 to 41.9% in October to December 2019, a reduction of 7.7 percentage points. In comparison, the economic inactivity rate for non-disabled people reduced by 2.3 percentage points during this period.
Figure 3: Economic inactivity rate for disabled and non-disabled people aged 16-64, UK, not-seasonally adjusted, April to June 2013 to July to September 2020
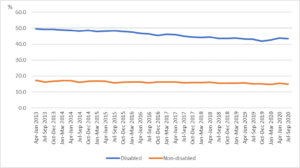
Source: Office for National Statistics – Labour Force Survey. For a more accessible version, please visit our accessibility policy.
Disability and Gender
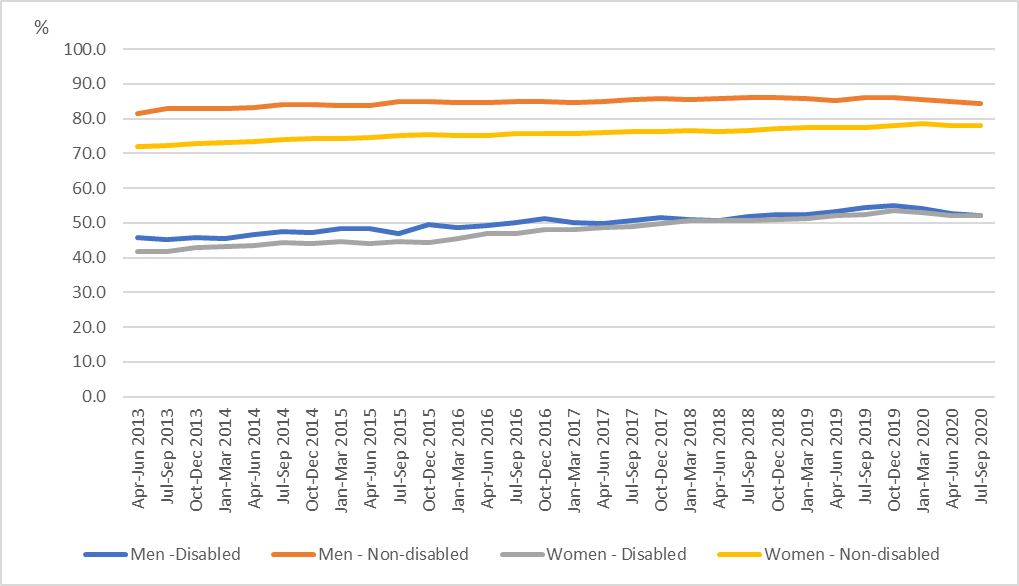
Employment rates for disabled men and women are similar and have converged between April to June 2013 and July to September 2020. This is also the case for non-disabled people, although the employment rate for non-disabled men remains higher than for non-disabled women.
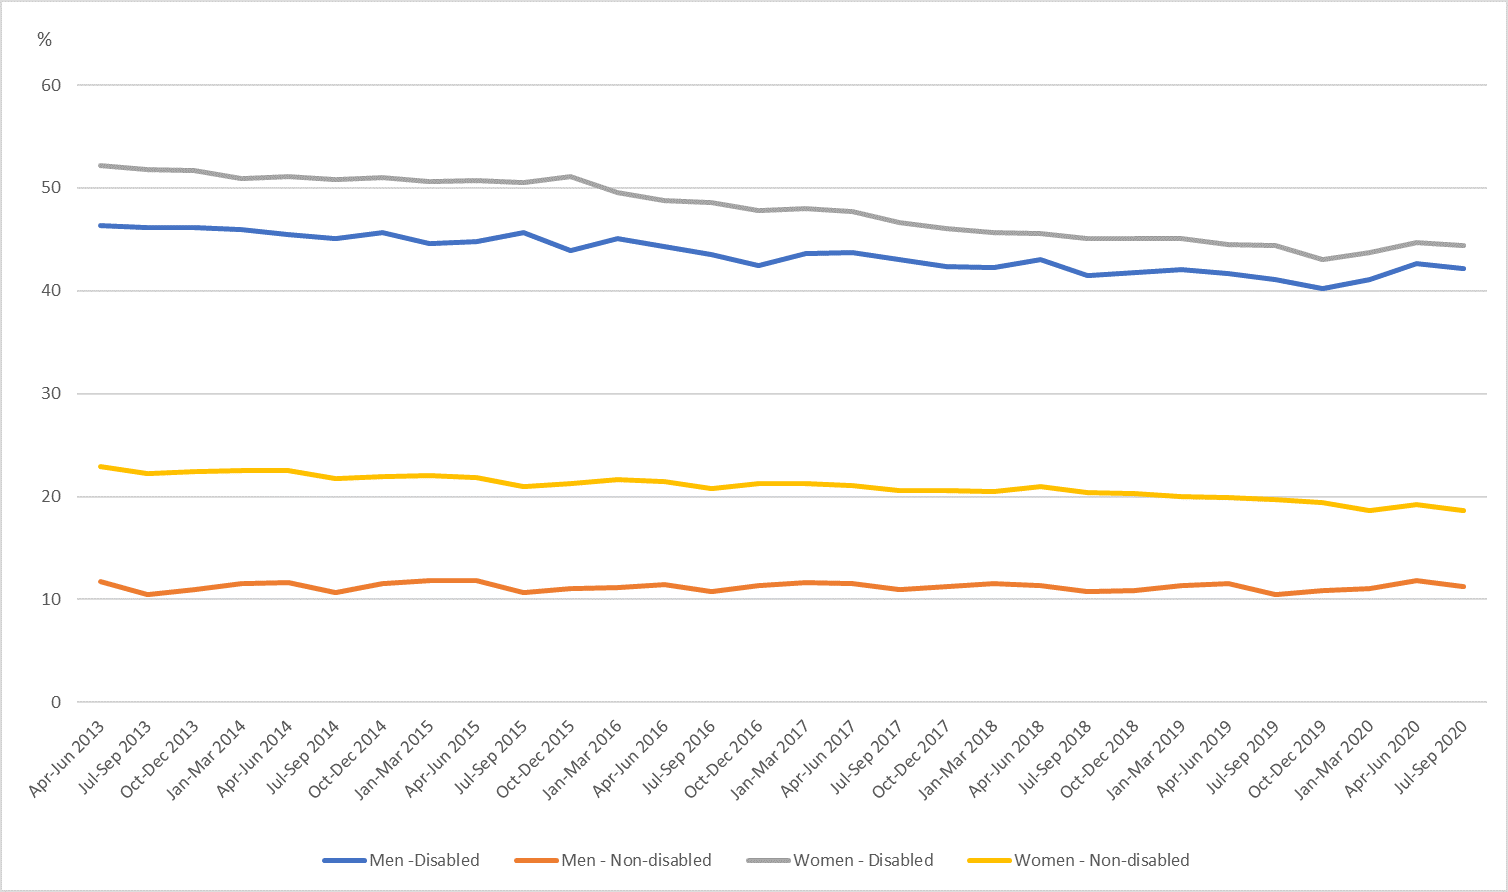
Figure 4: Employment rate for disabled and non-disabled men and women aged 16-64, UK, not-seasonally adjusted, April to June 2013 to July to September 2020
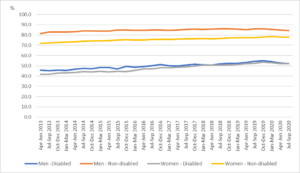
Source: Office for National Statistics – Labour Force Survey. For a more accessible version, please visit our accessibility policy.
The largest employment gap has consistently been between disabled and non-disabled men. In July to September 2020, the disability employment gap was 32.2 percentage points for men and 26.0 percentage points for women.
The employment rate has risen more rapidly for disabled women, increasing by 11.6 percentage points between April to June 2013 and October to December 2019, compared with a 9.2 percentage point increase for disabled men. Smaller increases (when compared with their disabled counterparts) have been seen for non-disabled women and men in this period; non-disabled women showed a larger increase (6.0 percentage points) than non-disabled men (4.7 percentage points). Since the end of 2019, the disability employment gap has increased slightly for both men and women.
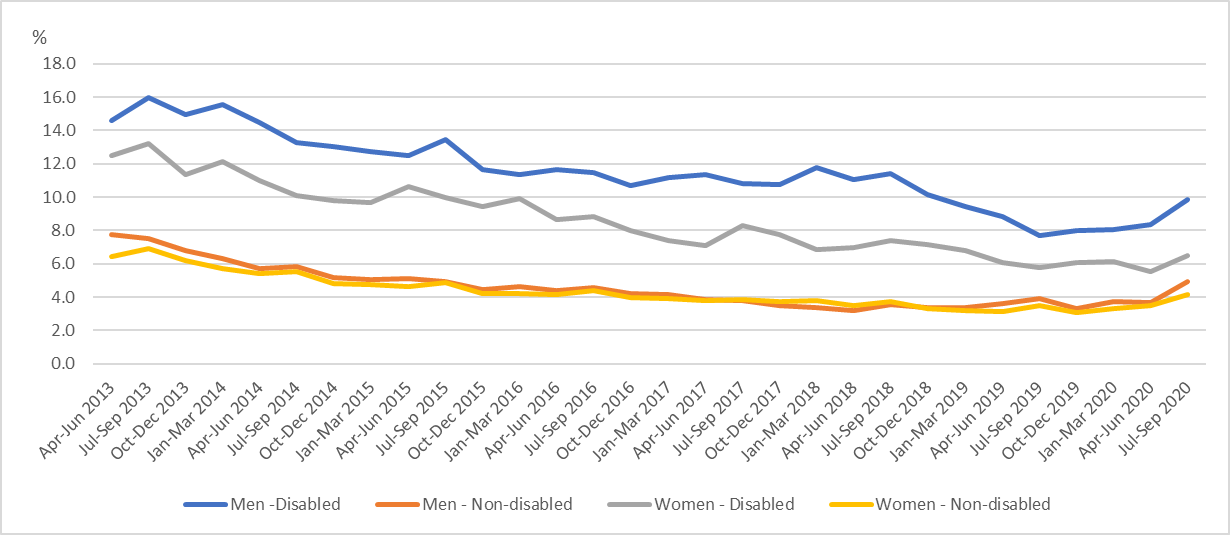
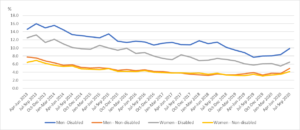
The unemployment rates for disabled men and women differ more than for non-disabled men and women. Over time the unemployment rate has been decreasing at a similar rate for both men and women, although there has been increases in recent months.
Figure 5: Unemployment rate for disabled and non-disabled men and women aged 16-64, UK, not-seasonally adjusted, April to June 2013 to July to September 2020
Source: Office for National Statistics – Labour Force Survey. For a more accessible version, please visit our accessibility policy.
Since April to June 2013 disabled men have consistently had a higher unemployment rate than disabled women. This gender gap narrowed slightly (1.9 percentage point difference) at the end of 2019 but has increased to a difference of 3.4 percentage points in July to September 2020.
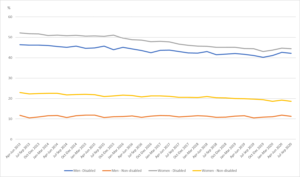
The economic inactivity rates for disabled men and women are more similar than those for non-disabled men and women and, in both cases, have converged between April to June 2013 and July to September 2020.
Figure 6: Economic inactivity rate for disabled and non-disabled men and women aged 16-64, UK, not-seasonally adjusted, April to June 2013 to July to September 2020
Source: Office for National Statistics – Labour Force Survey. For a more accessible version, please visit our accessibility policy.
The economic inactivity rate has decreased more rapidly for disabled women, decreasing by 9.1 percentage points between April to June 2013 and October to December 2019, compared with a 6.1 percentage point decrease for disabled men. Smaller decreases (when compared with their disabled counterparts) have been seen for non-disabled women and men in this period; non-disabled women showed a larger decrease (3.5 percentage points) than non-disabled men (0.9 percentage points).
Coronavirus pandemic and the labour market status of disabled people
Looking specifically at the effect of the pandemic on the employment of disabled people, comparing the last unaffected quarter (October to December 2019) to the latest data (July to September 2020), it appears that the disability employment gap has widened slightly.
The employment rate for disabled people fell from 54.1% to 52.1% over that period. The rate of decrease was smaller for non-disabled people, causing the disability employment gap to increase by 1.1 percentage points between October to December 2019 and July to September 2020. Looking at gender breakdowns over the same period, the disability employment gap has increased by 1.1 percentage points for men and 1.4 percentage points for women.
The unemployment rate for disabled people increased by 1.0 percentage points between October to December 2019 and July to September 2020, and for non-disabled people the rate increased by 1.3 percentage points. This larger rate of increase for non-disabled people has resulted in a slight narrowing (0.3 percentage points) of the difference in unemployment rate between disabled and non-disabled people.
Looking at gender breakdowns over the same period, men see the largest increases in unemployment rates for both disabled and non-disabled people, with the gap in unemployment rates between disabled and non-disabled people increasing by 0.3 percentage points for men and decreasing by 0.6 percentage points for women.
The difference in economic inactivity rates between disabled and non-disabled people reached a record low in October to December 2019, however this difference has widened since the start of 2020. The economic inactivity rate for disabled people increased by 1.6 percentage points between October to December 2019 and July to September 2020, and for non-disabled people the rate decreased by 0.2 percentage points. Economic inactivity for the non-disabled group appears to have only seen a temporary effect from the pandemic due, in part, to people moving from economic inactivity to unemployment after the first lockdown; however, the economic inactivity rate for disabled people remains at a similar level to that seen in the first half of 2019. Looking at gender breakdowns for disabled people, men saw larger increases in economic inactivity rates than women since the end of 2019 (1.9 percentage points for men and 1.3 percentage points for women).
Social impacts of COVID-19
The ONS has published a series of articles on the social impacts of COVID-19 on disabled people in Great Britain, using data from the Opinions and Lifestyle survey. The data have consistently shown that a lower proportion of disabled people than non-disabled people were worried about the impact of the pandemic on their work or travel to work; 24% of disabled people reported being worried about the impact of the pandemic on their work compared to 37% of non-disabled people in the latest data available for September 2020. However, this may be because disabled people are less likely to be in employment, less likely to travel under normal circumstances and tend to be older.
In the latest data available for September 2020, of the disabled people who reported their work was impacted, being worried about health and safety at work (24%) or hours being decreased (23%) are the most frequently reported ways work was affected. Disabled people (24%) were also evidence more likely to report concerns about health and safety at work than non-disabled people (14%).