Chapter 9: Defence
Reflecting around 10% of total public services, Defence has consistently been one of the top five largest categories since the public services productivity (PSP) statistics commenced from 1997. Nevertheless, the challenge of measuring productivity in Defence has been a long-standing conceptual issue, both in the UK and elsewhere, which was not resolved in the Atkinson Review (2005), or subsequent research, including Prtak, 2019, RAND Europe, 2021.
Post-Atkinson, whilst the Office for National Statistics (ONS) published a number of conceptual papers, no substantive progress had been achieved to move beyond an ‘inputs = outputs’ model. Defence, therefore, remains the largest single service which is treated in this fashion. Whilst the Ministry of Defence (MOD) has considered the issues of measuring defence output in the intervening years, it has also been unable to definitively deliver an appropriate approach.
In Defence, as with other areas without strong measures, the ONS measures of productivity may not adequately reflect departmental activities to improve productivity. However, MOD is establishing a Productivity Portfolio to drive a co-ordinated and systematic approach to capturing both cashable and non-cashable benefits, as announced in the Public Spending Audit for financial year ending 2025. As part of this, a consistent methodology to track benefits will provide a view on the efficiency of intermediate consumption in MOD. Furthermore, MOD has developed a measure of output termed “readiness”, which is a defined and measured state of military preparedness.
The Review commissioned a report from Professor Ron Smith (Emeritus Professor of Applied Economics, Birkbeck, University of London) via the Economic Statistics Centre of Excellence, to consider measurement of defence productivity.
Smith, 2024. summarised the historical evidence and concluded:
“For defence, there is a problem of comparability because the nature of the activities, capabilities and objectives of defence change over time, and for good reasons, as threats, technology and strategy evolve… When these activities or capabilities are discontinued to reorient to the new context, measured output will have fallen while the military are fully occupied doing different activities. For defence, performance measures include elements such as success in operations, maintaining readiness, and stopping equipment being delivered late, over budget and not meeting technical requirements. These are difficult to convert into indicators that would match national income accounting criteria.”
The Review took a two-stage approach to this work:
- Developing improved inputs measures. This is a necessary condition of developing stronger methods, whether ‘inputs = outputs’, or utilising direct output measures.
- Developing methods to introduce a direct measure of output.
The work on input measures reached a state of maturity sufficient to enable recommended improvements which will be implemented into the ONS statistics from Spring 2025. The output work is still at a conceptual level and whilst some data are presented to inform discussion, the Review recommends further work to develop this further, not least because new readiness data could become available in the near future from MOD, which needs to be considered before final decisions can be made.
9.1 Core methodological and data challenges identified
Measurement of defence inputs and outputs
Input measurement in this area has relied on indirect approaches, essentially deflated expenditure at the aggregate level. As with many services, data improvements since Atkinson (2005) allow a move to direct measures, as described in this chapter.
Defence output is difficult to directly measure for several reasons:
- The service is not provided to the individual and can be hard to define: is deterrence or active deployment, or both, or something else, the delivered output? This leads to three problems:
- How to value deterrence?
- What to include in the measure of active deployment?
- How to weight active deployment and deterrent outputs together? This matters as assumptions made could result in productivity automatically jumping or falling when forces move into or out of an active deployment. Whether this seems appropriate is a valid question.
- Defence output could be conceived as either one output or multiple outputs.
- Defence outputs are closely related to the UK’s allies and their spending. Periodic proposals to develop jointly new capabilities, such as the AUKUS (a trilateral security partnership between Australia, the United Kingdom, and the United States) submarine programme; sharing intelligence, such as through the Five Eyes alliance (an Anglosphere intelligence alliance comprising Australia, Canada, New Zealand, the United Kingdom, and the United States); multinational peacekeeping missions, such as through the United Nations (UN); and collective security agreements, such as the North Atlantic Treaty Organization (NATO), mean there is a need to consider how to reflect expenditure by other governments which, by principle, Atkinson argued should be excluded.
Recognising these challenges, the Review explored several conceptual models and derived some methods for determining a value for deterrence discussed in Annex E. The remainder of the chapter addresses these, including the strengths and limitations of each approach, as well as making some improvements to the ONS input measure.
Granularity of data collected on military defence
The Classification of the Functions of Government (COFOG) defines the different services this Review is considering and as described in Chapter 6, is currently under review itself. The ONS continues to work closely with MOD and the UN Task Team on the revision to COFOG, with defence being high on the UK’s list of priorities for potential improvements.
Irrespective of the methods discussed in this Chapter, the Review has identified potential improvements regarding how defence spending is currently classified and reported to HM Treasury. The COFOG structure for Defence does not have the granularity of other services of the same relative scale. It categorises expenditure under Division 2 – Defence, which includes:
- 2.1 Military Defence
- 2.2 Civil Defence
- 2.3 Foreign military aid
- 2.4 R&D Defence
- 2.5 Defence not elsewhere classified
Much of the MOD’s expenditure is therefore reported under the broad category of 2.1: Military Defence. Spending on NATO-specific operations, such as peace-keeping overseas and similar expenditure is captured under 2.3. This lack of granularity hinders detailed analysis and productivity measurement. In particular, it prevents comparison of a country’s army, navy and air force through grouping them together. Following discussions with experts, it is the recommendation of the Review that it would be advantageous to split COFOG 2.1 further, to differentiate at least the operation of land, air, and sea forces (and possibly also cyber and space).
Recommendation 57:
As input to the UN Review of the COFOG the ONS should recommend that COFOG 2.1 Military defence should be split as follows:
- Division: 02 – Defence
- Group: 02.1 – Military Defence
- Class: 02.1.1 – military defence of which contains operations of land forces
- Class: 02.1.2 – military defence of which contains operations of air forces
- Class: 02.1.3 – military defence of which contains operations of sea forces
- Group: 02.1 – Military Defence
9.2 Improvements to inputs estimates
Labour measurement
Labour can be measured directly in terms of staff numbers, or indirectly via the expenditure on staffing divided by a relevant deflator. Accounting for the skill mix of the workforce by including rank or grade and salaries allows for a more accurate time series to be produced, showing how the workforce changes throughout time and with policy. Annex F provides greater depth as this topic is addressed by a number of chapters.
Following Atkinson’s (2005) recommendation, the ONS and MOD worked together on evaluating how the measurement of defence could be improved in the UK National Accounts. Anagboso and Spence (2009) recommended using a direct measurement of defence labour, considering the skill of the work force by disaggregating civilian and military staff based on their rank or grade and salary.
Further ONS research, Kamarudeen (2010), examined the feasibility of incorporating the improvements to labour suggested in the 2009 research paper. This stated that a chained Laspeyres volume index that considers the quantity and quality of the defence labour force was being included in the ONS’ Public Sector Output and PSP publications, and hence proposed its inclusion in the UK National Accounts. If a direct labour measurement were to be introduced in defence, the statistics would hold more value as the public would have a better understanding of how the flow of personnel numbers differs across time, and with changes in policy.
However, these recommendations were not implemented because of resource constraints. Defence labour inputs are currently captured indirectly by deflating current price expenditure on defence by a derived deflator based on the COFOG.
The Review revisited this debate and is satisfied this methodological development should be implemented based on existing available data. A precedent for this approach can be seen in policing where similar measures are used to break down labour inputs by rank or grade, average annual pay, and expenditure, and then subsequently deflated using a generic Central Government pay deflator.
For civilian personnel employed in defence, which comprise ‘non industrial’ (e.g. civil servants) and ‘industrial’ (e.g. auxiliary staff, apprentices) personnel, the Review obtained a complete time series of grade data, but pay data only from 2007 onwards because of historic pay groupings. For consistency, the Review used data which groups the pay of civil servant grades for senior civil service (SCS), Grade 6 with Grade 7, senior executive officer (SEO) with higher executive officer (HEO), and administration officers (AO) with administrative assistant (AA); executive officers (EO) were their own category. Pay was imputed prior to 2007 by negative compound average growth rates.
In years prior to 2004, ‘Non-industrial Civilian’ Full Time Equivalents (FTEs) for grades 6 and 7, SEO and HEO, and, AO and AA, respectively, were banded together. In the absence of disaggregated data, the ONS could forecast individual grade FTEs by their average proportions in the three most-recent years with observed data. For example, in 2003 the total FTE of Grades 6 and 7 combined was 2,470. To get an approximation of grade 6s, the total, 2,470, is multiplied by the ratio of Grade 6s relative to the combined sum of Grade 6s and 7s from 2004 to 2007. This is repeated for all grades that are constructed this way.
In years prior to 2009, ‘Industrial Civilian’ FTEs were banded together. The same methodology as previously described is applied to get approximate disaggregation of industrial grades.
The ONS follows the direct process separately for military and civilian personnel and combine each total growth contribution by the implied expenditure share of each staff division split. For example, if the total civilian labour volume grows by 5% in year t, and total civilian labour comprise 60% of total defence labour expenditure in year t-1, the contribution of civilian staff to total defence labour inputs growth is 3% (i.e. 5% of 60% which is 3% of total civilian labour). A similar calculation is completed for military personnel and then these are summed to create the final contributions.
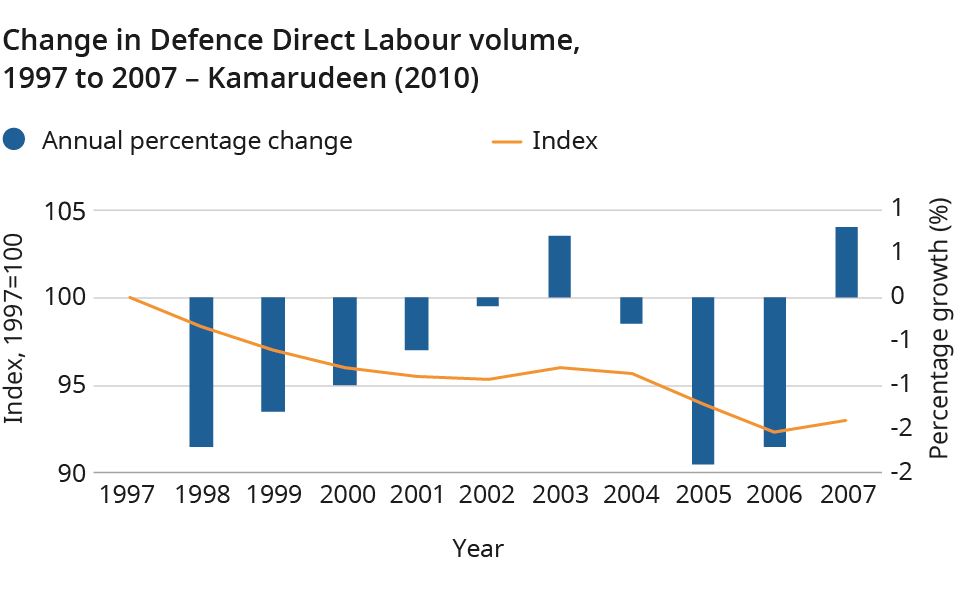
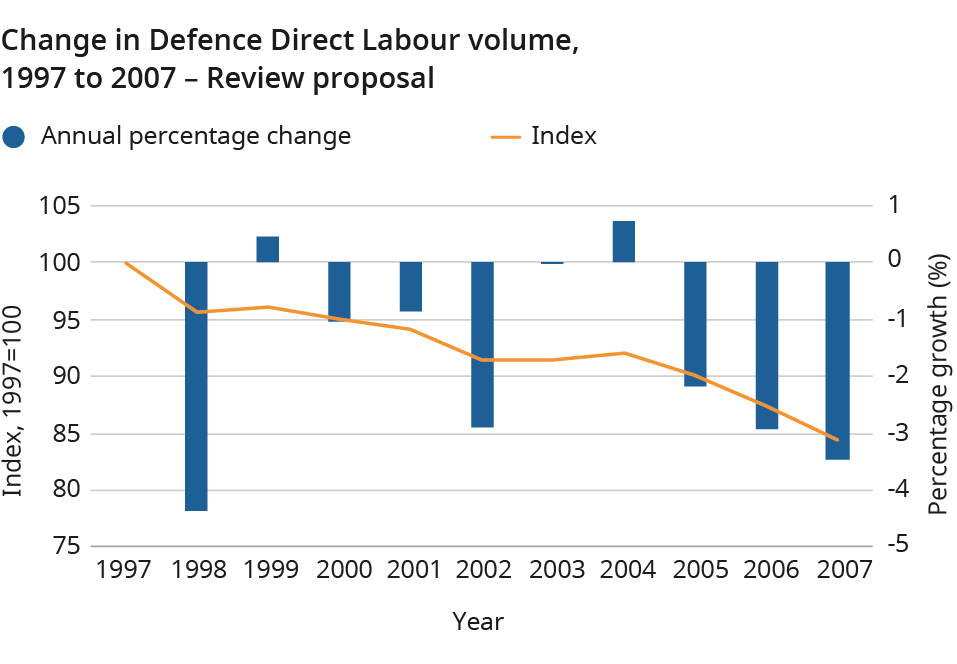
The derived direct labour volume index was compared with the index presented in Kamarudeen (2010), who similarly adopted a direct labour estimation approach. Figures 1 and 2 show an encouraging similarity of trend. The proposed index falls at a steeper rate, particularly in the early period (1997 to 2002), but the general growth patterns are similar. Both depict a sharp fall in 1998, followed by transient growth to 2004, before another sharp fall to 2007. To note, methodological and data intricacies mean they are not expected to match perfectly, however it is encouraging to verify the broader growth pattern.
Figure 1: Direct labour volume Kamarudeen (2010)
Figure 2: Direct labour volume growth, 1997-2007 (2024 version)
Recommendation 58:
A new method implementing a more granular direct measure of labour inputs into Defence should be applied.
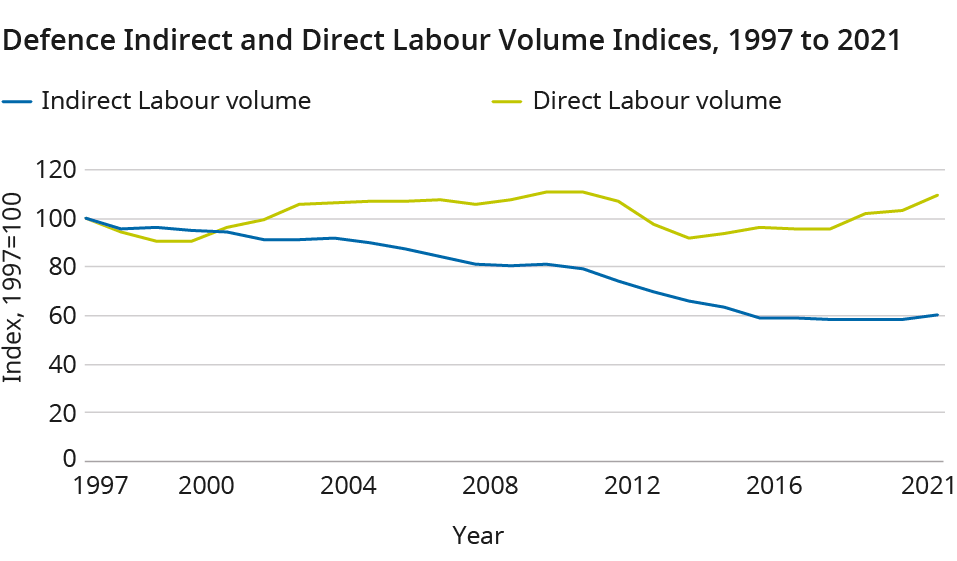
Comparing the proposed series results with the previously published series shows a significant difference which begins in the early 2000s. The Review has worked with experts to understand this, and the key factor appears to be changes in the pension regime for military and civil service personnel via the employer contribution. This increased current price expenditure, without being visible in the deflator used to convert staff expenditure into volume. This led to price change being mis-labelled as volume change. The new methodology more accurately portrays the change in the volume of labour inputs into the Defence service through this time period.
Figure 3: Indirect and Direct Labour Volume Index, Comparison, 1997-2021
Intermediate consumption
Given the proposed move to a direct labour estimation approach, intermediate consumption (IC) current price expenditure will need a bespoke deflator applied to it to create volume metrics. The Review recommends deflators be applied to Defence IC expenditure items with observed expenditure used to weight items. In the absence of weights prior to 2013, an average weight of expenditure is used as weights are fairly consistent across observed series. In the absence of deflators in the early part of the time series, growth rates from comparable deflators should be applied to the earliest data point available to impute the historical series.
Recommendation 59:
A UK National Accounts consistent intermediate consumption deflator should be derived and applied to Defence intermediate consumption spending, using the His Majesty’s Treasury Online System for Central Accounting and Reporting (OSCAR) data to weight components.
Capital
The Review analysed two proposals to provide new capital deflators, neither of which is entirely satisfactory. Both use data on capital expenditure supplied from the Online System for Central Accounting and Reporting (OSCAR) system:
- Proposal one uses the implied deflator from the national accounts for defence capital items produced in the UK. The weakness of this approach is that simply because an item is manufactured in the UK, this does not mean it was purchased by MOD, nor that MOD’s pattern of consumption mirrors that of defence purchases from overseas.
- Proposal two is to use a deflator derived from the defence contract prices index published in MOD’s ‘Defence Inflation Report’. However, the Review has been advised that the defence contract prices include elements of labour and intermediate consumption and hence is not strictly a capital deflator.
In light of this, the Review recommends incorporating both methods to quality assure the results, given neither approach can be considered superior, using the national accounts capital deflator as the lead metric.
Recommendation 60:
The Review recommends that the national accounts capital deflator should be applied to the Defence capital expenditure data, but the combined implied deflator of intermediate consumption and capital should be compared to the Defence contracts price index to determine whether subsequent manual intervention is then required.
9.3 Improvements to outputs estimates
Working with experts, the Review has attempted to develop theoretical solutions to the question of how to measure defence output. This remains work in progress and Annex E summarises the research. These methods are not proposed for implementation at the present time but do act as a major step forward in how to think about this issue.
Whilst the Review considers these as being the most feasible methods currently available, this does not mean that data are always available, or do not lead to non-volatile results. Feedback and comments on the content of Annex E are welcome to contact psp.review@ons.gov.uk.
Recommendation 61:
The ONS should continue to explore the direct measurement of Defence output with Ministry of Defence and other experts following the publication of this report.
9.4 Quality adjustments
Until a suitable output metric has been agreed, the Review concludes it is too early to consider quality adjustments. The treatment of output, either reflecting active deployment, deterrence, or both, and the exact methods and measures deployed will so fundamentally alter the perspective that considering quality at this point may be superfluous.
9.5 Devolved governments
Given the UK government has sole jurisdiction in this service, there are no devolved government considerations.
9.6 Recommendations for further work
It is clear that the methodological complexities of measuring defence are exacerbated by challenges around data. MOD’s programme to create a new readiness measure is a key step to enable further methodological work. It is the understanding of the Review that long time series of readiness data is not planned to be created. Nevertheless, the ONS should work to seize the opportunity these data may present.
Recommendation 62:
The ONS should continue to work with Ministry of Defence to explore the potential of using their new readiness measure within the calculation of Defence outputs, and to continue to develop appropriate methods.


