Annex E: Defence outputs research
This Annex presents a summary of research work to develop a suitable output estimate for Defence services.
The reason this topic is so challenging is because output should reflect the activities being ‘undertaken’, but this definition is one where great caution is required. The Ministry of Defence (MOD) defines its purpose as being “to protect the nation and help it prosper” with priorities to “… protect the UK, its Crown Dependencies, and its Overseas Territories; pursue a campaigning approach to counter the threats from state and non-state actors; promote our national interests globally; and secure strategic advantage, achieve greater economic and industrial resilience, and contribute to national prosperity.”
Given this definition of MOD’s objectives, deterrence is clearly fundamental: one of its objectives is for UK military forces to present an image of strength and readiness to react in order to deter any attack and ‘protect the nation’. In a perfect world, deterrence therefore implies that active deployment of the armed forces is to be avoided if possible. Clearly, a scenario where there was no use of Defence services would seem to imply no output, but this would be incorrect. For example, defence capital assets, such as aircraft carriers and ships, are designed both to perform their function in rare combat situations, and to act as a deterrent to prevent conflicts from arising or escalating. However, estimating outcomes such as ‘wars avoided’ is highly speculative, as is measuring threats such as ‘potential military attacks’.
Deriving a suitable ‘unit’ of deterrence is challenging and multiple attempts have been made over time. Many rely on estimating the capability of the military to deliver against its stated objectives but even this has proved challenging. This is because the levels and types of capability of the armed forces vary over time, dependent on the type of threat, the arena in which deployment may be necessary, technological advances (e.g. the emergence of drones as a fighting platform), and military strategy. The 2024 House of Commons Defence Committee report “Ready for War” provides additional context on this point.
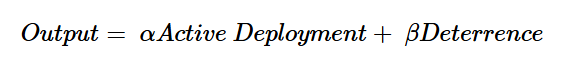
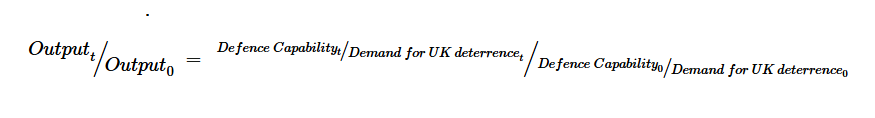
Nevertheless, active deployment clearly is an output which needs to be considered and taken into account. The Review therefore starts with a basic formula to shape its conceptual work:
Figure 8
The Review has concluded that producing direct outputs measures for Defence is a three-part problem:
- Developing activity measures relating to a directly observed measure of active deployment.
- Considering models for estimating deterrence, where this can be characterised as the deterrence value delivered by non-active deployment.
- The calculation of a weighting model to combine the two into an overall measure of output.
In addition, the Atkinson Principles states to only consider those matters under the government’s control to determine productivity is pertinent. As an increase in healthiness to the health service would not be counted if it was caused by individuals independently deciding to take up going to the gym, should the actions of potential hostile state and non-state actors be a determination of capability? If a hostile foreign state doubled spending on military hardware, including long distance missiles, would the capability, assuming the type and level of spending stayed the same, halve? Would it offer less of a deterrent? Or is the deterrence determined by the stock of assets held by that foreign actor, which the long-range missiles could destroy? Again, growth in foreign National Balance Sheets or Gross Domestic Product is not under the control of the UK Government and hence should it be in scope?
Compounding the theoretical challenges, there are issues of pragmatism too: there is a considerable degree of confidentiality with regard to the activities and capabilities of the military for reasons of national security, thus rightly limiting data availability. Therefore, even where methods may be feasible in theory they may not be in practice. Furthermore, there is a question of ethics when considering the frameworks for Defence output.
If the UK’s preference is towards deterrence, then this implies that it has a greater weight than active deployment. However, this would also imply that, in the event of deterrence failing, a shift to active deployment would cause measured output, and hence productivity, to fall. Conversely, if active deployment is weighted more highly and the same inputs swap from being used for active deployment to being a deterrent at the end of a conflict, output and productivity would again fall.
It is clear this is not a simple argument. If the UK was a small country whose defence objectives were only domestically focussed, it would be easier to make a clear distinction between the two. However, as an advanced military power, there are three further complexities to consider:
- Defence activity often takes place through multi-national groupings, for example developing joint new capabilities such as through the AUKUS (a trilateral security partnership between Australia, the United Kingdom, and the United States) submarine programme, sharing intelligence such as through the Five Eyes alliance (an Anglosphere intelligence alliance comprising Australia, Canada, New Zealand, the United Kingdom, and the United States), and projecting power overseas in line with international law, for example as peacekeepers, all of which suggest an additional objective related to wider foreign policy as an outcome for Defence services.
- Membership of alliances such as The North Atlantic Treaty Organization (NATO) augments UK military power through agreements around collective defence and mutual aid, such as Article 5 of the North Atlantic Treaty. This means that the level of UK ‘homeland defence’ is not simply a factor of UK defence capability.
- Active deployment can serve as evidence of deterrence capability, or enhancement of the deterrence value of military forces through participation in training exercises. In other words, active deployment which makes the strength of UK and allied forces visible may act to increase the deterrence value of these forces.
This third point opens the possibility of double counting by trying to assess these two measures independently of each other.
E.1 Output in the form of active deployment
The measurement of active deployment output can be approached through two methods: using a single ‘macro’ indicator which acts as a proxy for the whole set of activities, or compiling a ‘micro’ driven approach, whereby the Review aggregates different activities which Defence services may deliver under active deployment. An example could be the person-days on active deployment. Clearly the exact composition of these would be key to successful implementation, but this is the model used in other services and the Review considers the ‘micro’ approach as best practice to be applied if a comprehensive set of measurable outputs can be achieved.
However, as with other areas, simply measuring the number of person-days on active deployment is clearly flawed because this quantity measure fails to reflect the dimension of quality. Defence is an area where technology, strategy, and implementation methodologies all matter and change quickly. For example, returning to the point about the value of alliances, UK operational capability has often been enhanced by a fundamental alignment of approach with the USA:
“…the 1991 Gulf War confirmed to British officers the importance of maintaining interoperability with developing US warfighting concepts, especially given the relative prominence the Americans afforded the British Army compared with other less modernized allied contingents.”
Source: Chapter 16 (Tactics and Trade-Offs: The Evolution of Manouvre in the British Army) in this book: Advanced Land Warfare: Tactics and Operations – Mikael Weissmann (ed.) & Niklas Nilsson (ed) (April, 2023)
As such, some method to ‘quality adjust’ any directly observed output metrics relating to active deployment is clearly required, particularly as in many cases these outputs may appear little different from input measures of labour.
The Review looked to enhance the existing ‘inputs = output’ approach, through allowing the addition of capital to augment labour inputs. If it can be assumed that labour does not show quality improvements, and therefore does not change through time – that is a soldier in 2008 putting aside the technology available to them, is of equal capability as a soldier in 1998 or 2018 then capital investment can be treated as a proxy for how much more output each unit of labour delivers. Whilst basic and not particularly elegant, this model would deliver a starting point to impute outputs distinct from the valuation of inputs. However, despite the concept appearing to work in theory, it was not possible to practically implement.
This is because the Review explored the potential to use evidence from significant capital projects and the investment cases which are produced to deliver these. In many areas of government these contain estimates of the total costs and benefits (both discounted to present day terms), and the ratio of benefits to costs, which could be used as a proxy for the degree to which these investments enhance labour inputs. However, due to the difficulty of defining outputs, benefits cannot be monetarised, which makes deriving the ratio of benefits to costs very difficult. Additionally, there were security concerns about including data on active deployments.
However, work at MOD may shortly lead to publication of statistical data on a measure of readiness. The definition of Readiness, which is broadly aligned with NATO’s recommendations, is based on:
- Availability: the number of platforms (e.g. tanks, frigates, drones etc) within a particular time frame.
- Capability: what the platforms can do.
- Sustainability: how long these activities can be sustained for.
As work to measure readiness is in progress, there may not be scope to include data for the entire back series from 1997. This is due to the difficulties in retroactively applying qualitative methodology to historic shifts in policy focus. For example, it may not be possible to determine ‘Readiness’ of the armed forces in 2003, due to the lack of availability of the databases which are used to inform the current statistic in development. As another potential limitation, due to the nature of the data that inform the Readiness metric (from MOD strategic risk assessments), the Office for National Statistics (ONS) may not be able to access and scrutinise the data behind the numbers; only aggregated Readiness numbers may be available.
Nevertheless, if MOD began to routinely publish outputs based on Readiness at an aggregated level, then Inputs multiplied by Readiness could give a conceptual framework for looking at outputs. The Review has recommended the ONS and MOD should continue to work to explore the potential of these data.
Readiness therefore provides an estimate of the military preparedness to respond to emerging operations; that is, to deploy onto active service. If an aircraft carrier is immobilised, that is clearly a case of output not being delivered for the input resources used. In this case the deterrence attributable to and actionable by the military is also weakened as potentially hostile actors can factor in such limitations in the UK’s defence capability into their decision making. As such, the concept of readiness has the potential to also proxy for the deterrence value of Defence services: the readiness of military forces to react and engage is clearly a feasible definition of deterrence.
Therefore, whilst the Review has considered deterrence models, Chapter 9 highlights the need for future work in this area.
E.2 Output in the form of deterrence activities
What is ‘deterrence’ and how should it be best thought of? Deterrence is the deployment of the threat of force to deter other nations or actors from considering that it would be beneficial to use force against the UK. How best to measure this? The easiest way to consider this is that the UK has means of estimating its ‘value’, and that an attack would diminish this value through destruction of people and places. The RAND Study (2021) serves as a basis for exploring conceptual models, but noted it would be difficult to gauge whether the public feel more “protected” for having a Defence service, in the absence of any imminent international threat. This ties in with wider arguments that there are challenges in determining society’s optimal Defence output.
The Review assumes that, recognised by the public or not, the value of the demand for deterrence can be considered as the reduction in the probability of an attack multiplied by the value of the assets being protected multiplied by the proportion of these assets which could be destroyed in any such incident:
Figure 9

Mathematically, demand for deterrence would therefore increase if:
a) The value of the UK’s assets increased.
b) The military capability of potentially hostile actors increased (that is if the destructive capacity of their weapons increases the proportion of UK assets which could be destroyed in an incident).
c) The likelihood of potentially hostile actors of any particular size (represented by spend) attacking the UK increased (that is the probability of an incident occurring increases).
In this model the Review assumes that UK defence capability is akin to an insurance policy, where for output to be held constant, the inputs (over time) are calibrated to the relative value of UK deterrence desired.
Taking a particular time as a reference point, if UK defence capability (proxied by spending in the first instance) increases by more than the value of UK deterrence then one could argue output has increased (that the UK has purchased more insurance relative to the value of the risk), and conversely if the value of UK deterrence demanded increases by more than UK defence capability, one could argue output has fallen (that the UK has purchased less insurance relative to the risk). Therefore, if one can find data sources for the formula components, one can attempt to estimate Defence deterrence output.
Components in Demand for UK Deterrence
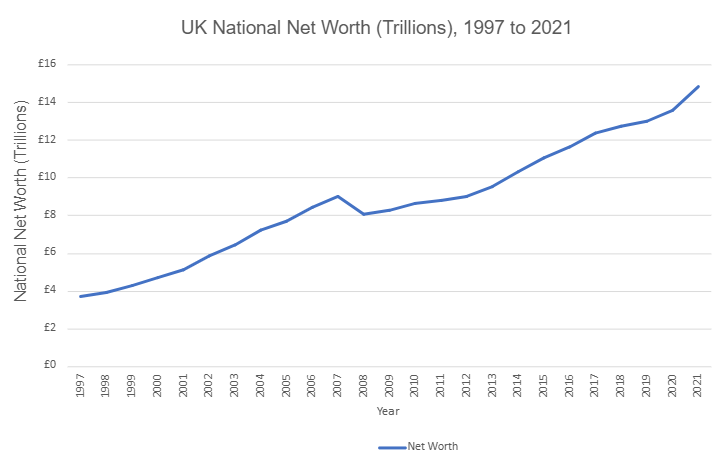
The value of UK assets: The UK National Accounts records the Net Worth of the UK. Whilst this estimate of the value of the capital assets of the UK omits human and natural capital, it presents a starting value which can be used. These data are readily available in monetary terms.
Figure 10: UK National Net Worth, 1997 to 2021
Economic cost of a deterred attack: Clearly an attack would not destroy all economic value in the UK. Assuming that all attacks are not equal, the measure needs to adjust this factor over time. Obviously, the Review cannot expect to foresee the precise scale of any attack and hence an expected or average scale of attack in that year needs to be derived which allows a value to be computed. However, given the fact there have been no substantive incidents of physical damage in a prolonged period, there is a limited degree of sophistication possible. For simplicity, the Review proposes this factor would need to be held constant and will be assumption-based, on the basis of the capability of weapon systems available to potentially hostile actors, but clearly additional evidence would be beneficial in this area. Additionally, the very concept of economic disruption has evolved, with cyber-attacks providing an alternative type of attack which should be factored in.
The probability of incident occurring: Four methods for considering this component have been considered:
- Military knowledge.
- National Threat Levels.
- Spend by potentially hostile state actors.
- The Global Risk Index.
Military knowledge: One could assume that there is military knowledge and intelligence which could provide relevant information, but this is unlikely to be accessible for security reasons. For this reason this source was discounted as a viable option.
National Threat Levels: The National Threat levels are monitored and updated by the Joint Terrorism Analysis Centre, which involves the police and security services. This source was discounted as a viable option for the following reasons.
- These could be conceptually too far removed from the international military threat, covering terrorism (including domestic terrorism) etc.
- Although the threat levels are regularly updated, they do not change much over time; for example, the threat level staying at “severe” for several years might be too static for comparing the productivity of the military over time.
- There are standard challenges of converting cardinal scales such as the Threat Level into ordinal values; particularly the assumptions of linearity and homogeneity. Linearity relates to the assumption the movement from one category to another is the same all the way up the scale (the movement from 1 to 2 is the same as the movement from 6 to 7 etc). In this case, is the increase in threat to move from ‘severe’ to ‘critical’ the same as to move from ‘low’ to ‘moderate’? Homogeneity relates to whether a threat level recorded as ‘severe’ in one period would be consistently recorded as ‘severe’ in all other time periods. Assuming this system is being consistently applied and through a robust structure these assumptions should hold, but even so, how to reflect this information?
Spend by potentially hostile state actors: Initial discussions with the MOD in December 2023 highlighted a number of practical challenges which suggested this approach would not be appropriate. There are difficulties in acquiring data for the military capabilities for aggressive actors. Firstly, these are hard to quantify, and secondly it would not be appropriate to share data on this, due to national security concerns. Spend is available, for example via the World Bank, but it would seem inappropriate to assume that inputs work as a strong proxy for other countries if the calculations are deliberately assuming that the value of the output of UK defence differs from the value of its inputs. In short, capability does not necessarily equal spend and therefore spend is not a good metric.
Further considerations
However, assuming different countries are gaining capability at a broadly similar rate, relative spend may give sufficient signal about deterrence to meet the review’s need. That is, if potential aggressors quadruple their military spending, the current spend of the UK, all other things being equal, would become less of a deterrent, and would need to increase by a similar factor to deliver the same amount of deterrence. There are, however, three key issues to consider:
- What to do with allies? The deterrence from attacking the UK is not just a factor of the UK’s military capability. The UK is a member of a number of military alliances, particularly NATO which mean that an attack on one is perceived as an attack on all. How does the Review take account of the spend of allies? How does the Review take account of UK’s spend on alliances that also benefit others? The analysis does not include allied spending at the present time, but clearly this would be a key next step.
- Who should be included within potential threats? What makes a country or actor a threat to the UK? Is this just a question of doctrine or policy? Or is it also a question of capability? Striking a balance of these two suggests that the Review is looking at a subset of those nations who have ‘expeditionary capability’ – that is the ability to project power beyond their boundaries or immediate neighbours – who have doctrinal or other clashes with the UK or western norms. Whilst this may provide a baseline, if the countries which meet these criteria were to change, this may have a material ‘step-change’ impact on the output measure, assuming no change in UK defence capability. Whether this would feel a fair reflection of Defence services is a valid question.
- Is relative spend a sufficient proxy? Does the Review consider that the different actors will experience similar paces of technological change? If it is viewed that potential aggressors may have slower rates of technological advancement or different price deflators then relative spending over time may become more or less effective relative to UK spending.
Having interrogated World Bank data, the Review found the results to deliver extremely volatile and erratic trends, strongly suggestive that different countries had experienced very different inflation or technology paths to the UK, or there may be some mis-reporting of spend data. Results were so extreme the Review was unable to recommend their use at this time for this purpose.
The Global Risk Index
An alternative approach is that based on the Caldara and Iacoviello (American Economic Review, 2022) Geopolitical Risk (GPR) Index, which is a measure of adverse geopolitical events and associated risks. The index is based on automated text-search results of the number of articles related to adverse geopolitical events using the electronic archives of ten US and UK newspapers. The GPR Index spikes around the two world wars, the Korean War, the Cuban missile crisis, and following the 9/11 attacks in the US. A higher geopolitical risk is associated with the higher probability of economic downturns and risks to the global economy.
The historical GPR Index starts in 1900, and the recent index starts in 1985, and country-specific indexes are constructed for 44 different countries. The text-search is organised in eight categories: war threats (1), peace threats (2), military build-ups (3), nuclear threats (4), terror threats (5), beginning of war (6), escalation of war (7), and terror acts (8). There are two sub-indexes, geopolitical threats based on categories (1) to (5), and geopolitical acts based on categories (6) to (8).
This dataset is produced on a standardised basis for a number of countries, including the UK, and provides the strongest dataset the Review has been able to source.
Deterrence as an insurance model: This approach takes forward successful aspects from previous methods and works through an insurance supply and demand model for UK Defence output.
In this case, the Review treats domestic deterrence capability as a function of defence spending, given the size of protected assets and probability of attack. The UK’s insurance demand is the value of assets to be insured given the estimated risk to those assets. Domestic assets are given by national accounts estimates of UK non-financial assets (ONS); whilst the risk to those assets is given by the UK’s estimated geo-political risk index, as described in Caldara and Iacoviello, 2022. Insurance supply (‘input’) is simply the UK’s total defence spending, supplied by the World Bank.
From this point, an insurance ‘output’ is then derived which is the ratio of insurance supply to insurance demand, and ‘productivity’, which divides the output by the ‘input’ (insurance supply).
Figure 11: The UK Geopolitical Risk Index (1997 to 2021)
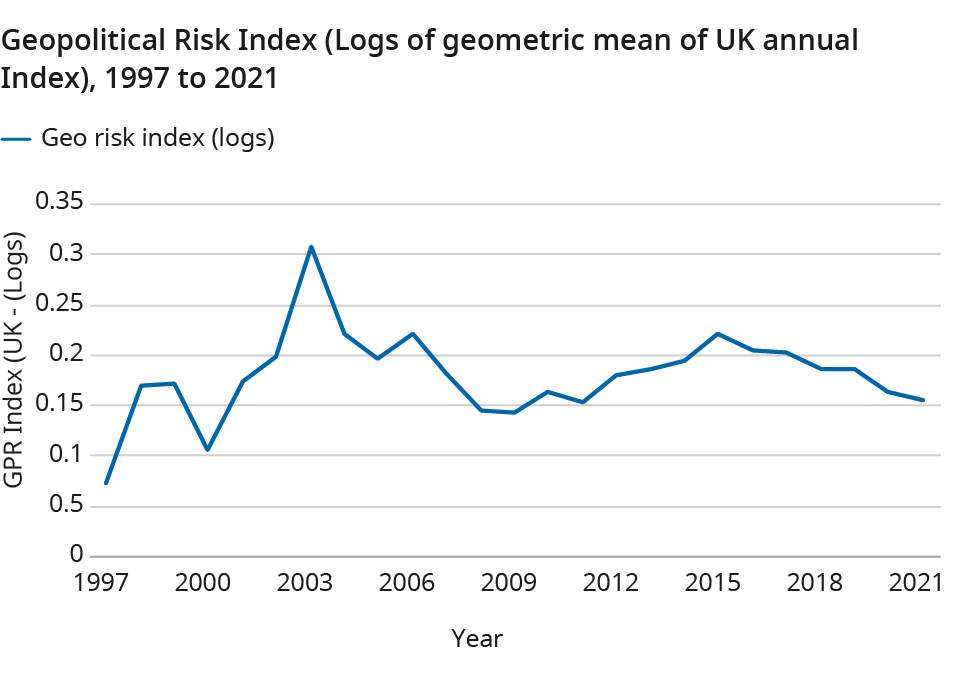
Reviewing this dataset shows distinct break-points. The 1990s are characterised by values which reflect the evolving resolution of the Cold War, during which large military forces were still being retained and ‘peace dividends’ had not yet been cashed. The 9/11 attacks mark a clear breakpoint in the series. In the absence of further research, the Review anticipates that this may form such a substantive break in the series that it may not be possible to take comparable analyses back before 2002.
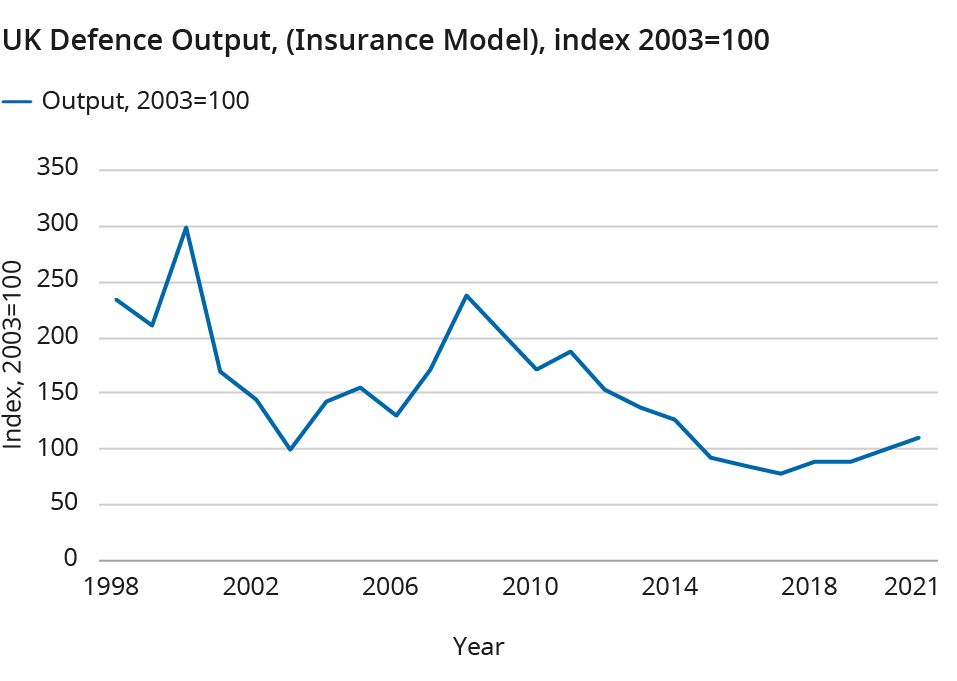
Nevertheless, it appears that using this data source does deliver a broadly believable path for Defence output. The increase in deterrence capability up to 2009 is driven primarily by falling demand for insurance and the insurance supply becoming relatively more proficient. From 2009 (to 2015), the series is falling as the risks exposure increases but spending remains fairly constant. The UK therefore became less-well insured. It should be noted, however, that the range of the movements appears unfeasible: did military output really increase by 60 index points between 2003 and 2008, and then fall by an equivalent amount from 2008 to 2015?
Figure 12: UK Defence output, utilising the Geopolitical Risk Index (1998 to 2021)
E.3 Conclusions
It is noted that in this initial estimation used, the UK defence spend was used as a proxy for UK defence capability. Again, the new data on readiness may provide a means to make the necessary adjustments and provide a single, unified measure of Defence output, recognising that measuring both active deployment and deterrence may result in double-counting, and presents challenges to weight these two outputs together. The latest method developed, which combines the two aspects (including formula mentioned in figure 13, 14 and 15 into a single metric is as follows:
Figure 13

Figure 14

Figure 15
Where year 0 = 2002
Beyond issues of sourcing data and understanding the volatility of results, there remain with this model some conceptual issues: for example, in a scenario where Defence output increases – that is defence capability increases relative to the value of deterrence – could this represent ‘over-insurance’? Is buying ‘too much’ insurance a positive output? The UK National Accounts principles – that all goods and services produced are output – would suggest that the answer is yes, but the opportunity cost of this spending may suggest a need to quality adjust.
Secondly and similarly, if the level of Defence outputs fall – i.e. defence capability falls relative to the value of deterrence – and no attack takes place, has the UK produced the desired outcome at a lower cost? Is this a good thing? Does this suggest the Review should ‘invert’ the series so a fall in the ratio is perceived as an improvement? This is rather like the question of whether you can save money by not buying house insurance: most of the time you do, but there are occasions you lose very substantially. The struggle is this model has no place for an actualised attack. Looking back to the run-up to previous conflicts – for example the example of investment in the development of Spitfire and Hurricane aircraft prior to the commencement of World War II suggests that the calculation would not wish to disincentivise such activity by making more spending appear ‘worse’ in output terms prior to an actualised attack, if one was ever to occur. These questions suggest the need for continued methods debate with academics and MOD experts to reach an informed conclusion.
Back to top