Annex G: Social Security Administration
G.1 Calculation of Universal Credit output given composition complexities
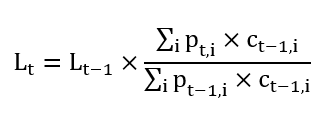
As Universal Credit is calculated on an additive-component basis where additional payments are made for additional entitlements, the Review can calculate the per household composition adjustment factor using a Laspeyres index:
Figure 18
Where:
I = index value of per household compositional adjustment
p = proportion of UC claims including component i
c = average contribution of component to overall UC benefit payment
t = year
i = component of UC
This approach uses a limited composition adjustment factor based on the first five components of the Department for Work and Pensions (DWP) Universal Credit formula that is used for calculating payments. These components are as follows (with the categories the Review used in brackets):
- Standard Allowance (Single or Couple)
- Entitlement for Children (Have 0 children, 1 child, 2+ children)
- Entitlement for Childcare costs if working (Claim childcare for 0 children,1 child, 2+)
- Entitlement for Disability (Capacity for work or Limited capacity for work)
- Entitlement for Disability (Carer or Not a carer)
- Housing element (Housing element or No Housing element)
The Review has utilised Stat-Xplore (the online DWP data portal for benefit statistics) for entitlement data, alongside experimental, unpublished data for the number of children and childcare elements. However, due to data limitations, this approach can only be used to measure Social Security Administration output growth for the period 2016 onwards.
G.2 Fraud and error quality adjustments
The quality adjustment derived from DWP’s fraud and error rates has been constructed as follows:
- A total fraud and error rates series is constructed back to 2008 by adding splined rates of overpayments and underpayment according to DWP’s Fraud and error in the benefit system annual report.
- Because these rates are small (at around 3-5%), the Review inverted the total fraud and error rates by taking it away from a value of 100 to essentially give a ‘correctness index’. This avoids the construction of a volatile index based on small rates.
- The growth rate of this correctness index is the Social Security Administration (SSA) quality adjustment, which is then added to the growth rate of the non-quality adjusted SSA output index.
Error rates are calculated in Figure 19 as follows:
Figure 19
Therefore, after swapping error for correctness, the combined DWP and HM Revenue and Customs (HMRC) correctness rate would be as per Figure 20:
Figure 20
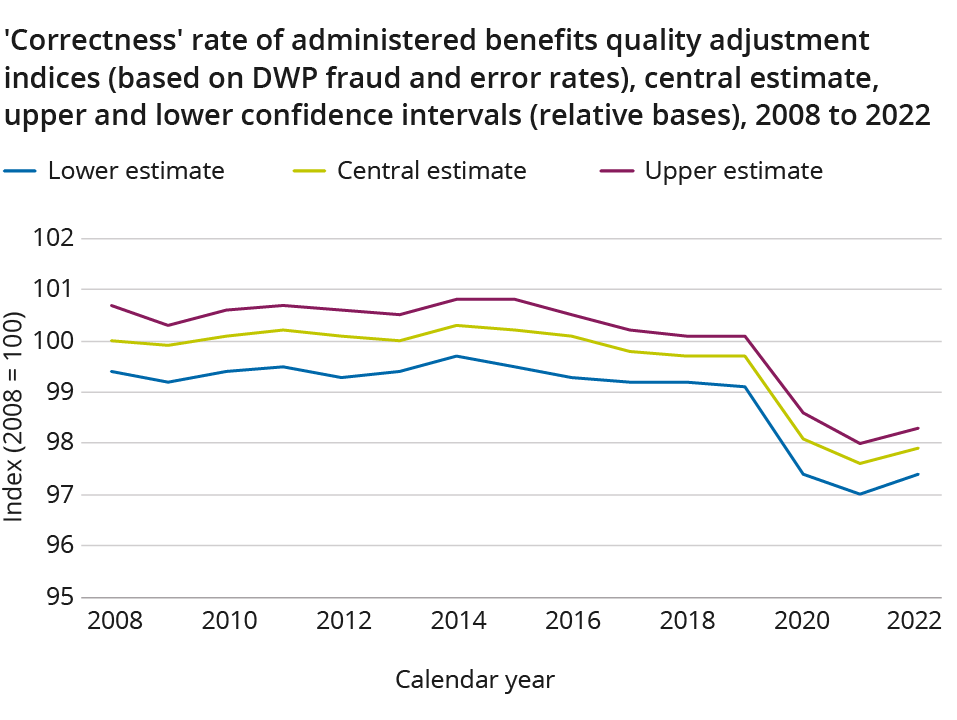
The proposed method for producing a “correctness” index for the combined correctness rate DWP payments is to base the series at 100 in 2007 and calculate a based index. This can be shown in Figure 21.
Indext=n=TotalCorrectnessRatet=nTotalCorrectnessRatet=0×100Indext=n=TotalCorrectnessRatet=nTotalCorrectnessRatet=0×100
This is valid until 2018, when DWP made a number of changes to their methodology. Because DWP have published statistics on both methods for this year, the growth rate can be calculated for 2018 to 2019 based on correctness rates from their new method. The index then continues from here as shown in Figure 21 and Figure 22.
Figure 21
Figure 22
Total fraud and error rates were relatively stable between 2008 to 2019 at around 3%, resulting in small quality adjustments between plus or minus 0.3 percentage points throughout this period. However, total fraud and error rates increased to around 5% from 2020, and therefore adjustments are larger in these years. The trend in the chart is partially due to complex cases being transferred to Universal Credit over time, which contribute to higher error rates within the system and may also reflects the introduction of “Trust and Protect” easements in response to the coronavirus pandemic (DWP Annual Reports & Accounts 2020/21). Nevertheless, the adjustment results in only small changes to both SSA’s quality adjusted output and productivity indices.


