Office for National Statistics written evidence submissions to the Health and Social Care Committee inquiry into men’s health

Dear Mr Brine,

I write in response to the Health and Social Care Committee’s call for evidence for the inquiry into Men’s Health.

As the Committee will be aware, the Office for National Statistics (ONS) is the UK’s National Statistical Institute and largest producer of official statistics. We aim to provide a firm evidence base for sound decisions and develop the role of official statistics in democratic debate. We produce a wide range of health publications, including official statistics on life expectancy, mortality, and mental health. Insights from these statistics may be of interest to the Committee as your inquiry progresses.

To develop our analytical priorities, we work with a range of stakeholders, including Government departments, academics and charities. For instance, for the work around suicide, we work with the National Suicide Prevention Strategy Advisory Group, chaired by Professor Louis Appleby with membership spanning government departments and a wide range of charities. Additionally, we engage with the Department of Health and Social Care to ensure our analyses are timely and policy-relevant, and with the Ministry of Justice and Office for Veterans’ Affairs on suicides among prisoners and armed forces veterans respectively.

What factors drive lower, and falling, male life expectancy and what action would have the biggest impact on addressing this?

Fall in life expectancy

Over the last 40 years life expectancy in the UK has been increasing, albeit at a slower pace in the last decade (see Figure 1). This increase has been primarily because of a reduction in mortality at older ages driven by advances in health care, and improvements in living and working conditions.

Our most recent publications show a slight decrease in the estimated life expectancy of males across the UK. Decreases have been reported at national level and at local levels. This was driven by the coronavirus pandemic which led to a greater number of deaths than normal in 2020.

Generally, the decreases reported in life expectancy at a local level are seen in areas where rates of deaths due to any cause were the highest. The first peak in coronavirus deaths was in April 2020, while the country was in the middle of the first national lockdown. At this time, urban centres in London, Birmingham, the north of England and South Wales had the highest rates of deaths due to any cause.

When producing the national life tables, we average mortality observed over three years to smooth out the impact of exceptional events, such as a flu epidemic, on reported life expectancy. Despite this smoothing, the excess mortality observed in 2020 led to estimates of life expectancy at birth for males for 2018 to 2020 falling to levels reported for 2012 to 2014. Female estimates of life expectancy were virtually unchanged from 2015 to 2017. The difference in trends for males and females reflects the larger increase in male mortality rates in 2020.

The slight decreases in life expectancy reported do not necessarily mean that a male born in 2018 to 2020 will go on to live a shorter life. This is because the reported life expectancies assume that the higher-than-average mortality observed in 2018 to 2020 will continue. It is possible that life expectancy will return to an improving trend in the future.

The latest national life expectancy estimates are provisionally scheduled to be released in November 2023. These estimates will cover the period 2020 to 2022.

Figure 1: Life expectancy at birth for males and females, UK, between 1980 to 1982 and 2018 to 2020

Graph comparing the life expectancy at birth for males and females in the UK, between 1980 to 1982, and 2018 to 2020

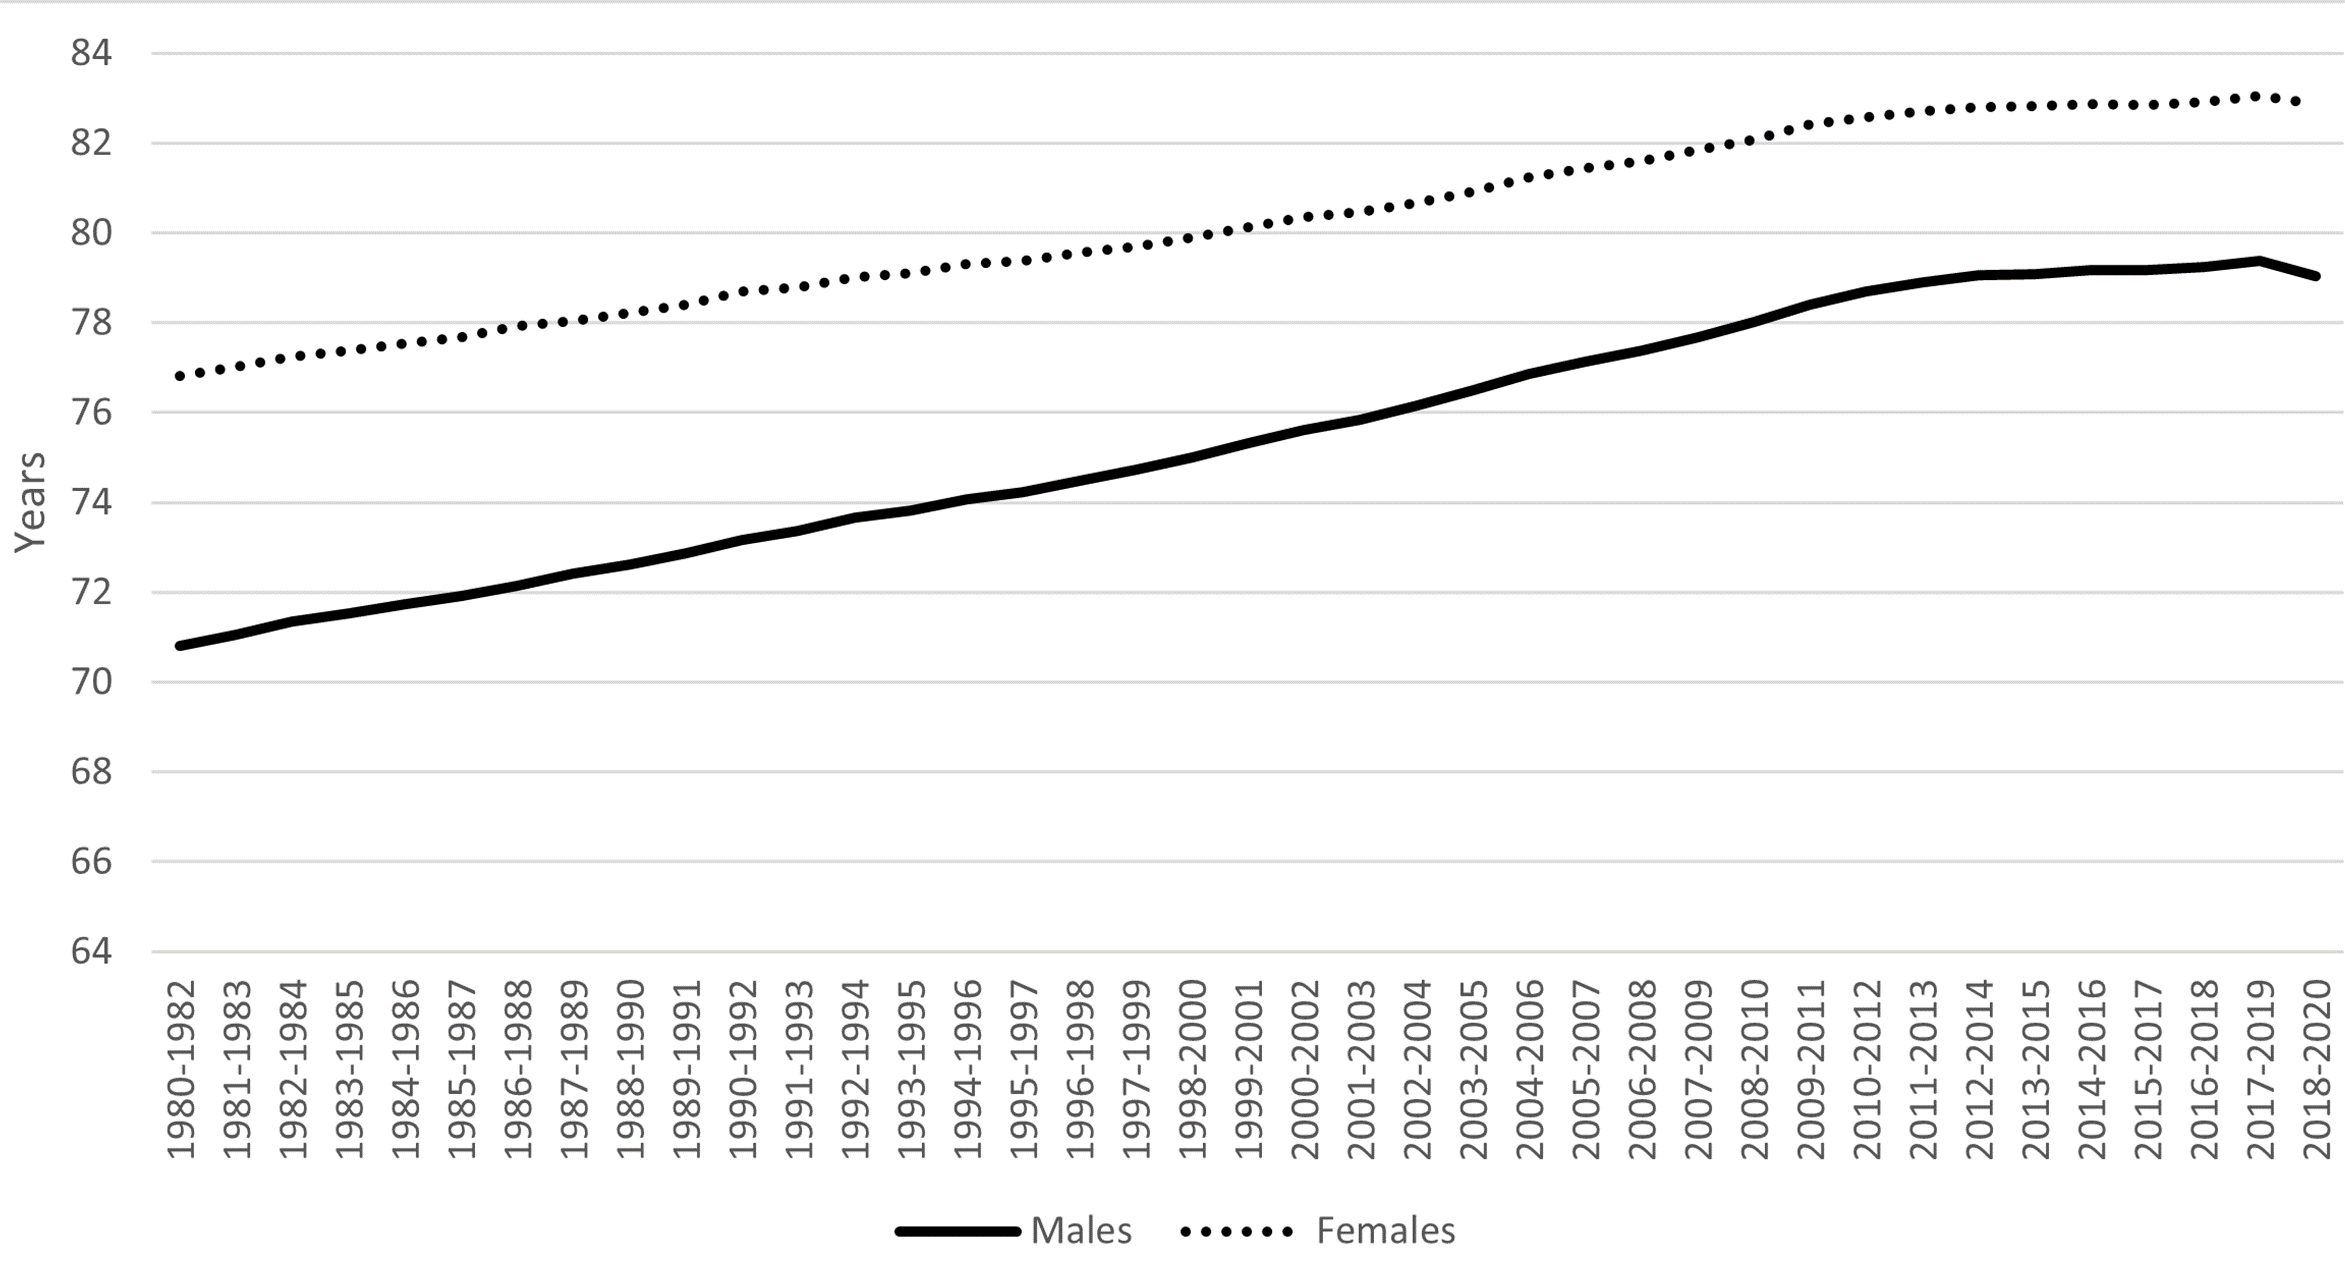
Source: Office for National Statistics- – National life tables – life expectancy in the UK: 2018 to 2020 For a more accessible version, please visit our accessibility policy.

Difference between males and females

As Figure 1 shows, despite improvements in life expectancy over the last 40 years there is a remaining difference between males and females. In the latest period, 2018 to 2020, life expectancy at birth in the UK was 79.0 years for males and 82.9 years for females. However, over the past 40 years the gap has steadily narrowed; from 6.0 years in 1980-82 (Male: 70.8, Female: 76.8) to 3.8 years in 2018-20 (Male: 79.0, Female: 82.9). Differences are also reporting with varying gaps when looking at lower geographical areas within the UK.

The difference in life expectancy between males and females is seen across the world, as highlighted by the Organisation for Economic Co-operation and Development (OECD). In the latest update, the UK had one of the narrowest gender gaps in life expectancy across OECD countries.

While a general trend of females having a longer life expectancy than males has persisted, it is important to note that ONS analysis based on ONS Longitudinal Study data has shown that socio-economically advantaged males in 21st Century are living significantly longer than disadvantaged females, something that wasn’t the case in the 1980’s or 1990’s. This is driven by a much greater increase in male life expectancy amongst advantaged men (categorised under the “Higher Managerial” and “Professional” classes) over the previous 40 years, with the Slope Index of Inequality showing the gap in life expectancy at birth for males widening from 5.6 years in 1980 to 6.4 years in 2016.

A sizable contribution to the lower life expectancy observed in men is made by a higher rate of avoidable deaths. This refers to deaths that are preventable or treatable, including neoplasms (cancers), which represent the largest driving cause of avoidable mortality.

In 2019, avoidable deaths were 59.0% higher among males than females, this gap has narrowed since 2001 when it was 75.0%. Deaths involving alcohol-related and drug-related disorders are the only category of causes where the age-standardised mortality rate (ASMR) has statistically significantly increased since 2001.

Avoidable mortality can also be split up into preventable mortality, which are deaths that can be avoided through health interventions before the onset of diseases or injuries (to reduce incidence) and treatable mortality, which are deaths that can be avoided through healthcare interventions after the onset of disease, to reduce case-fatality. In 2019, preventable deaths were 89.0% higher in males than females, but this too was lower than in 2001 when the gap was 110% higher, while treatable mortality was 19.0% higher in 2019, a fall from 32.0% in 2001.

The ONS conducts specific analysis on drug poisoning deaths in England and Wales. Males accounted for more than two-thirds of registered drug poisonings in 2021 (3,275 male deaths compared with 1,584 female deaths), which is consistent with previous years. The male rate of drug misuse deaths was 77.5 deaths per million in 2021 (2,206 registered deaths) and the female rate was 29.3 deaths per million (854 deaths).

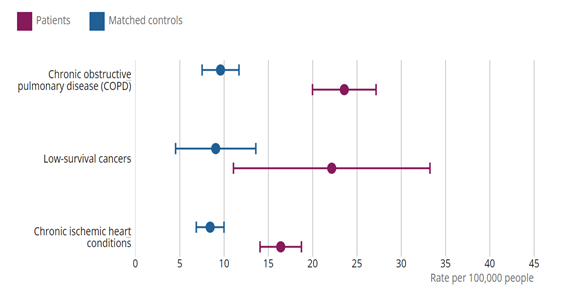
The most recent analysis from the ONS on inequalities in mortality involving common physical health conditions in England found that the age-standardised rate of all-cause mortality (per 100,000 person-years) was 1.3 times higher for males than females during the period 21 March 2021 to 31 January 2023. Males also had higher age-standardised rates of mortality for most individual conditions examined (Figure 2). In absolute terms, the biggest differences were observed for chronic ischaemic heart disease (232.0 for males, 94.5 for females), pneumonia (207.8 for males, 129.0 for females), diabetes (156.1 for males, 91.5 for females), and heart failure (167.9 for males, 103.8 for females).

Figure 2: Age-standardised mortality rates (per 100,000 person-years) and 95% confidence intervals for deaths involving common physical health conditions by sex, England: 21 March 2021 to 31 January 2023

Graph showing age-standardised mortality rates (per 100,000 person-years) and 95% confidence intervals for deaths involving common physical health conditions by sex, England: 21 March 2021 to 31 January 2023

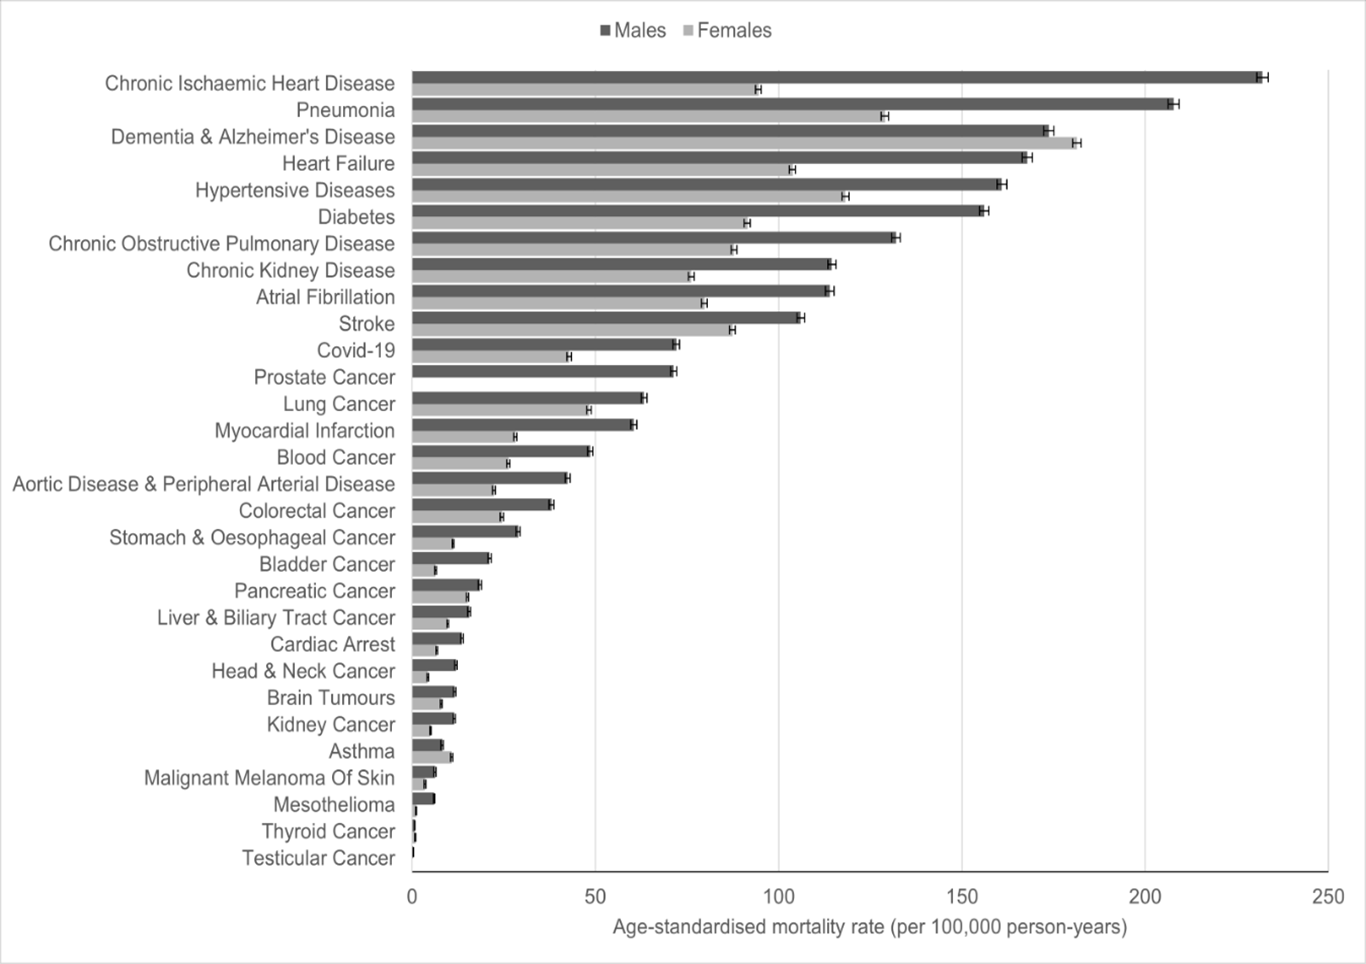
Source: Office for National Statistics – Inequalities in mortality involving common physical health conditions, England: 21 March 2021 to 31 January 2023 For a more accessible version, please visit our accessibility policy.

What is driving higher rates of suicide amongst men and how could this be addressed?

As seen since the mid-1990s, males accounted for three-quarters of suicide deaths registered in England and Wales in 2021. Suicide appears in the top five common causes for men under the age of 50, where health conditions related to ageing are less prevalent than those in older age groups. When looking at age-specific suicide rates by broad age groups men aged 45 to 64 have had the highest age-specific suicide rates since 2010. Males aged 10 to 24 years have had the lowest rates since 1981. In 2021, the rate in this group was 8.0 deaths per 100,000.

Male rates for all age groups were higher in 2021 than in 2020, except for those aged 75 years and over where the rate remained unchanged. We saw a significant increase in the rate of deaths registered as suicide in 2021. This increase was the result of a lower number of suicides registered in 2020, because of the disruption to coroners’ inquests caused by the coronavirus pandemic. The 2021 suicide rate was similar to the pre-coronavirus pandemic rates in 2018 and 2019. The latest available evidence shows that suicide rates did not increase because of the coronavirus pandemic, which is contrary to some speculation at the time.

Our Sociodemographic inequalities in suicides in England and Wales: 2011 to 2021 publication also highlighted differences between males and females. Further, it showed that for men aged 40 to 50 years, the highest rates of suicide were in disabled people, those who have never worked or are in long-term unemployment or are single (never been married or in a civil partnership). For ethnicity, rates of suicide were highest in the White and Mixed/Multiple ethnic groups for both men and women. People who reported belonging to any religious group had lower rates of suicide, compared with those who reported no religion; however, rates were higher in Buddhists and “Other” religious groups.

We have also looked at the risk of suicide and drug-related deaths among prisoners, based on confidential matching of data from HM Prison and Probation Service and Office for National Statistics mortality records. Male prisoners were at an increased risk of dying by suicide compared with the general male population; the risk of male prisoners dying by suicide was 3.9 times higher than the general male population between 2008 and 2019.

There will be a range of factors to consider when tackling suicide rates. The Committee will be considering access to services that may help those at risk of suicide. The ONS have produced analysis on access to health care, looking at the socio-demographic differences in use of Improving Access to Psychological Therapies (IAPT) services. It showed men with a probable common mental disorder were less likely to access IAPT services than women.

We have also conducted analysis on prevention of future death (PFD) reports for suicide. Coroners have a duty to issue a PFD any person or organisation where, in the opinion of the coroner, action should be taken to prevent future deaths. A total of 164 PFD reports were available. For context, around 5,000 suicides are registered in England and Wales each year. As such, PFD reports are only issued for a small number of cases. The NHS (including health boards, trusts, clinical commissioning groups, primary care services, health and care partnerships and ambulance services) were the most frequent recipient of PFD reports, having received 42.0% of all reports. Of the 164 reports, around 62.0% of the deceased were male, 37.0% were female. The analysis highlights the range of concerns raised by coroners following a suicide, including processes not being followed, and inadequate documentation and monitoring, which may have prevented a death. We hope this analysis will provide valuable insight for those concerned with suicide prevention.

Please let us know if you would like to discuss any of this further.

Yours sincerely,

Emma Rourke

Office for National Statistics correspondence to the Health and Social Care Committee’s inquiry on assisted dying/assisted suicides

Dear Mr Brine,

I noted the Health and Social Care Committee’s inquiry, ‘Assisted dying/assisted suicide’ and wanted to highlight analysis the Office for National Statistics (ONS) published in April 2022, ‘Suicides among people diagnosed with severe or life-threatening conditions, England, 2017 to 2020. This analysis looked at the risk of suicide in people with severe health conditions.

In April 2021, then-Secretary of State for Health and Social Care Matt Hancock MP wrote to the National Statistician expressing concerns about a lack of data on suicides where the person had been diagnosed with a terminal illness. He asked if the ONS would publish the appropriate data. The ONS agreed to assess the possibility of completing such analysis and to work with colleagues in the Department for Health and Social Care to do so.

ONS mortality records do not include medical conditions on the death certificate. However, the development of the Public Health Data Asset (PDHA), which links mortality records to the 2011 Census and Hospital Episode Statistics (HES), allows us to analyse wider medical circumstances of individuals before death. The study population consisted of all persons, alive on 1 January 2017, who were resident in England, and enumerated at the 2011 Census. People who travelled abroad for the purpose of assisted suicide would not appear as having died in our data.

We used HES records to identify individuals that were diagnosed or receiving first treatment for the following three health conditions:

  • Low-survival cancer;
  • Chronic Obstructive Pulmonary Disease (COPD);
  • and Chronic ischemia.

These health conditions were chosen as in most cases patients with these conditions have a progressive condition which cannot be reversed by treatment and there is a substantial risk of death in those who are diagnosed. In many instances, people diagnosed with these conditions would meet the definition of having a terminal illness.

Our primary outcome was time to death due to suicide from the date of diagnosis which was restricted to between 1 January 2017 and 31 March 2020. The rate of suicide for patients with these conditions were then compared to rates for matched controls who were not diagnosed with these conditions. For each health condition, patients were matched on socio-demographic factors to ensure a reliable comparison.

There were 17,195 people who died due to suicide in the study period (1 January 2017 to 31 March 2020). Of these deaths, 455 (2.6%) were in patients diagnosed with COPD, 465 (2.7%) in patients with chronic ischemic heart conditions, and 58 (0.3%) were suicides in low survival cancer patients.

A diagnosis or first treatment for the selected health conditions is associated with an elevated rate of death due to suicide when compared with study participants with similar socio-demographic characteristics; participants known as matched controls. Matching is performed to assess whether the rate of suicide in people diagnosed with severe health conditions differs from that of people with a similar socio-demographic profile but not diagnosed with a severe condition.

Figure 1 shows that one year after diagnosis for low survival cancers, the suicide rate for patients (22.2 deaths per 100,000 people) was 2.4 times higher than the suicide rate for the matched controls (9.1 deaths per 100,000 people).

Figure 1: Suicide rate per 100,000 people, comparing patients who were diagnosed with severe health conditions with matched controls who have similar socio-demographic characteristics as patients but were not diagnosed with severe health conditions, England, Hospital Episode Statistics diagnosis, and deaths occurred between 1 January 2017 and 31 March 2020[1],[2]

Suicide rate per 100,000 people, comparing patients who were diagnosed with severe health conditions with matched controls who have similar socio-demographic characteristics as patients but were not diagnosed with severe health conditions, England, Hospital Episode Statistics diagnosis, and deaths occurred between 1 January 2017 and 31 March 2020

Source: Office for National Statistics – Public Health Data Asset For a more accessible version, please visit our accessibility policy.

Source: Office for National Statistics – Public Health Data Asset

One year after diagnosis for COPD, the suicide rate for patients (23.6 deaths per 100,000 people) was 2.4 times higher than the suicide rate for the matched controls (9.7 deaths per 100,000 people).

One year after diagnosis for chronic ischemic heart conditions, the suicide rate for patients (16.4 deaths per 100,000 people) was nearly two times higher than the suicide rate for the matched controls (8.5 deaths per 100,000 people).

Regarding people who travel abroad for an assisted death, unfortunately the ONS does not have access to any directly relevant data. Deaths of residents or citizens which occur abroad are recorded in line with the law of the country concerned and are not required to be registered in England and Wales under current legislation. Although a death abroad can be registered by the Foreign, Commonwealth and Development Office (FCDO) this process is voluntary, covers only a proportion of the deaths taking place abroad, and does not result in a civil registration available to the ONS for statistical analysis. There is therefore a gap in the international availability of official data concerning such deaths. The ONS will continue to engage with other national statistics institutes to examine how this data gap can be add addressed.

We continue to engage with stakeholders to understand demand for similar analysis in the future. We will keep you updated of any progress, and any future publications will be announced on the ONS release calendar

Please let us know if you would like to discuss any of this further.

Yours sincerely,

Emma Rourke

[1] Figures are for persons aged 10 years and over.

[2] The 95% confidence intervals are measures of the statistical precision of an estimate and show the range of uncertainty around the estimated figure.

Office for National Statistics written evidence to the Science and Technology Committee and the Health and Social Care Committee’s joint inquiry on Coronavirus: lessons learnt


Dear Mr Hunt,

While providing evidence to the Health and Social Care Committee and the Science and Technology Committee for the inquiry, “Coronavirus: Lessons Learnt” on 1 December, I promised to provide further information. Specifically, I am responding to queries from the Committees on international comparisons of mortality rates, specifically for groups who are ethnic minorities in the UK. I will address each of those questions in turn.

At what stage in the pandemic did the ONS become aware of the higher propensity for people from minority ethnic groups to die from COVID-19? (Q620)

Clinical studies identified apparent ethnic differences in COVID-19 mortality from April onwards, although the early evidence was inconclusive. The Office for National Statistics (ONS) began a research programme at the beginning of April to investigate population factors affecting COVID-19 mortality using linked data, and our first results were published on 7 May covering deaths that occurred between 2 March and 10 April. Subsequent analyses have included deaths occurring up to 28 July.

How has the UK done in comparison to other countries when it comes to ethnic minorities? How many Bangladeshis have died here in the UK [in comparison to Bangladesh]? (Q655)

Figures published by the World Health Organisation (WHO) show that the cumulative mortality rate (as of 29 November) from COVID-19 in Bangladesh is 9.9 per 100,000. Using WHO’s methods, the equivalent rate for the UK is 85.5 per 100,000. These figures cannot be directly compared to the ONS age standardised mortality rates, which for people of Bangladeshi ethnic background in England and Wales are 270.5 deaths per 100,000 in males and 110.0 per 100,000 in females, because of differences in methods. The figures from WHO on COVID-19 mortality are based on a mixture of reporting systems and estimates, and in developing countries such as Bangladesh are likely to be based on incomplete coverage; they are not age standardised, which is important as Bangladesh has a much younger population than the UK; and are not calculated based on the same exact time periods.

ONS has worked with partners including WHO, Eurostat, the French Institute for Demographic Studies (INED) and the Max Planck Institute for Demographic Research in Germany to help make comparative international data on COVID-19 mortality available. We published an analysis of excess all-cause mortality comparing the UK and most European countries on 30 July – all-cause mortality can be compared more reliably across countries than deaths from COVID-19 specifically. However, comparisons outside the small group of countries like the UK that produce comprehensive, detailed and timely cause of death data are very difficult due to different data collection systems and definitions, delays in availability, and in some cases substantial incompleteness. Even in countries with quite promptly available high-level data, breakdowns by ethnicity are not necessarily available. This is partly because ethnicity as it is measured in the UK is only given importance in certain countries, while in some (for example France and Germany) ethnicity is not officially recorded because of privacy concerns.

The published literature on COVID-19 and ethnicity so far focusses on the UK and the USA. The concept of ‘race’ used in official statistics in the USA is somewhat similar to the grouping of ethnicity in the UK. According to the US Centers for Disease Control (CDC) people of Black or African American race have 2.8 times the risk of death from COVID-19 compared to White people; see table 1 (below). These comparisons are based on age-standardised rates but not adjusted for socioeconomic factors. They show disparities of a similar magnitude to our findings for England and Wales, which were for example that males of Black African ethnic background have a rate of death involving COVID-19 2.7 times higher than White males, and females of Black Caribbean ethnic background have a rate 2.0 times higher than White females.

Table 1: Risk of death from COVID-19 for racial or ethnic groups in the USA, compared to White people (as of 30 November 2020)

Racial or ethnic groupIncreased risk relative to White group
Native American or Alaskan Native
2.6
Hispanic or Latino
2.8
Black or African American

2.8
Asian1.1

Source: Centers for Disease Control, November 2020


Why is there a discrepancy between the mortality rates for COVID-19 for minority ethnic groups in this country, making a direct comparison with countries where they are the ethnic majority? (Q656)

Comparison between the experience of COVID-19 among specific ethnic groups in the UK and in other countries associated with the ‘place of origin’ of those groups is fraught with difficulty for three main reasons.

Firstly, this is because of the limitations of ethnic group as a measure for analysis of mortality:

  1. Ethnic group is a social construct which in the UK is determined by the individual’s own identification with a community or background. It is not biological and can even change over time. For example, a person who identified themselves as Bangladeshi in a UK census might have been born in Bangladesh, in the UK, or in another country but have family or personal ties to Bangladesh.
  2. With a few exceptions, ethnic groups as measured in the UK are not specific to a single ‘place of origin’. For example, the group ‘Black African’ covers people who identify with any of 54 countries on the African continent, or indeed diaspora populations worldwide. Many African countries themselves contain multiple ethnic groups with diverse ancestry, culture and language.
  3. The characteristics of people belonging to a specific ethnic group in the UK are not necessarily similar to those of people currently living in an associated ‘place of origin’. The socioeconomic and environmental conditions experienced by people of ethnic minority backgrounds are more similar to the white communities around them than to residents of countries with which they or their ancestors may have been associated; in fact, research shows that over time immigrant communities take on similar health-related characteristics to the majority in the destination country. At the same time, ethnic minorities in Western countries may experience specific types of disadvantage with potential to affect their health, such as discrimination in employment or housing, which have no direct parallel in their ‘place of origin’. Risk factors such as the observed disproportionate concentration of ethnic minorities in certain public-facing and service occupations are specific to particular countries including the UK and the USA.
  4. Looking at health differences between ethnic groups which have a known biological or genetic explanation, these are very limited in scope. The most recent analysis from ONS found that taking account of pre-existing health conditions recorded in hospital records made little difference to the observed ethnic disparities in COVID-19 mortality. Observed ethnic differences in the prevalence of diabetes have been found in clinical studies to have some effect, but there is no evidence that such a factor can be generalised to non-Western settings where the population differ in diet and living conditions. Research in the USA found no significant difference in the prevalence of diabetes and other key health conditions between White and Black or African American populations

Secondly, mortality data which are timely, accurate and complete are hard to come by outside a relatively small number of countries which have well-developed civil registration and statistical systems. Some African and South Asian countries have less than 20% completeness in medical certification of causes of death. While this does not mean that the death rates from COVID-19 reported for those countries are completely unreliable, it should be recognised that they are estimates based on limited information. Limited access to virus testing and other diagnostic facilities in some countries could also play a role.

Thirdly, the demographic and geographical circumstances of many of the relevant countries are very different from the UK in ways which are likely to affect the outcomes of the pandemic:

  1. Most developing countries have substantially younger population structures than the UK; since vulnerability to COVID-19 is strongly correlated with older ages, lower mortality in those populations is to be expected.
  2. Although many developing countries have high-density urban populations, they also tend to have widely dispersed rural populations. This along with more limited international or long-distance travel than is seen in Western countries may have led to lower transmission of COVID-19.
  3. Other social and practical factors might be involved, such as greater willingness to comply with government restrictions, and previous public and healthcare system experience of combating other major communicable diseases such as polio, AIDS, SARS and Ebola.

I hope this information is helpful and look forward to an opportunity to update you on our further analysis on this important subject.

Yours sincerely,

Iain Bell

Deputy National Statistician and Director General for Population & Public Policy


Office for National Statistics oral evidence to the Science and Technology Committee and the Health and Social Care Committee’s joint inquiry on Coronavirus: lessons learnt (impact on BAME groups)

On 21 October 2020 Iain Bell, Deputy National Statistician and Director General for Population and Public Policy statistics, gave evidence to the Science and Technology Committee and the Health and Social Care Committee’s joint inquiry on Coronavirus: lessons learnt, specifically considering the impact of the pandemic on Black, Asian and Minority Ethnic (BAME) groups.

A transcript of which has been published on the UK Parliament Website.

Office for National Statistics oral evidence to the Science and Technology Committee and the Health and Social Care Committee’s joint inquiry on Coronavirus: lessons learnt (use of statistics and modelling)

On 21 October 2020 Professor Sir Ian Diamond, National Statistician, gave evidence to the Science and Technology Committee and the Health and Social Care Committee’s joint inquiry on Coronavirus: lessons learnt, specifically considering the use of statistics and modelling.

A transcript of which has been published on the UK Parliament Website.

Office for Statistics Regulation written evidence to the Health and Social Care Committee’s inquiry on Social Care: Funding and Workforce

Dear Mr Hunt,

I write in response to the Health and Social Care Committee’s call for evidence for the inquiry considering Social Care: Funding and Workforce.

The Office for Statistics Regulation (OSR) is the independent regulatory arm of the UK Statistics Authority.

We provide independent regulation of all official statistics produced in the UK, including those in Devolved Nations and the NHS. Our regulatory work is underpinned by the Statistics and Registration Service Act 2007.

We set the standards official statistics must meet through the statutory Code of Practice for Statistics. We ensure that producers of official statistics uphold these standards by conducting assessments against the Code. Those which meet the standards are given National Statistics status, indicating that they meet the highest standards of trustworthiness, quality, and value. We also report publicly on system-wide issues and on the way statistics are being used, celebrating when the standards are upheld and challenging publicly when they are not.

In January 2020, the OSR published findings from an in-depth review of Adult Social Care statistics in England. We are using this report as the basis for our submission to the Committee, the findings of which have never been more relevant as society adjusts to the rapid changes resulting from the ongoing coronavirus (COVID-19) pandemic.

There are gaps in the data and information that might tell us about the real cost of providing social care and ensuring good outcomes for people who need social care. Our review finds that this important sector of public policy is very poorly served by data. Social care has not been measured or managed as visibly as hospital care. The gaps in data and analysis make it harder for individuals and organisations to make informed decisions.

We want to see improvements to the existing statistics, as well as more fundamental changes. This will require a cross-government commitment to improvements. We strongly encourage the implementation of joined up data across health and social care to understand how the two systems interact, and what drives the best outcomes.

Our review highlighted three main areas for attention:

• Better leadership and collaboration across the many different organisations involved in the process of publishing official statistics on social care, that enables working across boundaries to join-up government departments, local authorities and between public and private sector providers.
• Addressing gaps in available data as most information available comes from local authorities with responsibilities for adult social services and does not cover private household expenditure, privately funded care, or the value of unpaid care, meaning the total cost of social care provision remains unknown.
• Improving existing official statistics through accessibility, coherence, quality, timeliness, and granularity of the data to provide insight and allow existing data to better meet user needs.

We have said for some time that there is no parity of measure between the health and social care sectors. The COVID-19 pandemic has had a significant impact on care homes and clearly shown that the approach to measurement in the social care sector has been lacking. In a response to the disease, there is now more data available on social care – this should continue after the pandemic ends.

The Committee may also be interested in our other work in response to COVID-19. This includes rapid regulatory reviews of new outputs from the Government Statistical Service, and statements advocating improvements to the presentation and availability of data on COVID-19.

We will continue to work with a range of organisations to make the case for improvements to social care statistics in England and more widely across the UK. We hope to raise the profile of these issues through this submission.

I look forward to seeing the conclusions of your inquiry. Please do not hesitate to contact me if I can be of any further assistance.

Your sincerely,
Ed Humpherson
Director General for Regulation


ANEX

Overview

1. This submission is based on the findings from our review of Adult Social Care Statistics in England published in January 2020.

2. Adult social care is a large and important area which requires strong evidence to support effective policy development, delivery of care and personal choice. Better data infrastructure and outputs which address the gaps in existing data are essential for individuals and organisations to make informed decisions

3. Improved data matters in solving problems, supporting efficiency, and maximising outcomes. It is also important to inform decisions made by individuals about the care they receive or provide for themselves and their families. Collaboration across traditional boundaries, across public and private sectors, is necessary to deliver the coherent and complete picture of adult social care.
Better leadership and collaboration

4. There needs to be a strong voice to champion statistics that meet a range of user needs and strong leadership to implement the required changes. Many different organisations are involved in publishing official statistics on social care. Making improvements will require collaboration across government departments; local authorities; and between public and private sector providers.

5. In line with the introduction of new technologies to assist healthcare, we want to see progress made with proposed infrastructure that will support the integration of health and
social care data so that there is a better understanding of the interaction between health and care and an individual’s experience. We welcome plans set out in the government’s vision for digital, data and technology in health and care. We hope the establishment of NHSX, a body to ‘progress digital transformation of the NHS’, will allow government to deliver on this ambition while considering data needs. There is also potential for the Office for National Statistics (ONS) to support the sector through innovative approaches to data analysis, such as data linking, and use of provisions in the Digital Economy Act.

Addressing data gaps

6. There are significant gaps in what adult social care data currently measures:

• Delivery of social care outside statutory control: Statistics on social care activity are primarily sourced from data provided by Councils with Adult Social Services Responsibilities (CASSRs). The established assessment criteria mean that many individuals privately funding care or receiving informal care have little or no contact with a local authority. CASSRs can therefore only measure part of the picture. These limited data have to act as a proxy for the whole social care sector. The information on unmet need and future demand is also limited.
• Funding outside statutory control: There are gaps in understanding of the scale of household expenditure on privately funded care and the value of unpaid care. There is no official estimate of the value of unpaid care provided by family and friends, but unofficial estimates that do exist vary between £100bn and £132bn per year, far exceeding HM Treasury spending*, giving a sense of the unacknowledged value of this support.
• Individual experiences and quality of care: There is little information on pathways and transitions between health care and social care – new infrastructure is required to effectively address this. There is also little information on the quality of care and outcomes for those who experience social care.

7. The gaps identified are significant and need to be addressed in order to support effective delivery and facilitate improved outcomes for those who experience social care. There is public and  policy interest in knowing about social care activity and spend wherever it happens, whether in the home, in a residential home or nursing home. The traditional route of relying on data collected by local authorities to complete official statistics is not enough.

Improving existing official statistics

8. Looking across existing statistics on adult social care we found some good examples of insightful analyses, However, there were many instances where we identified that improvements were necessary. There are improvements which should be made to the existing official statistics, around:

• Accessibility
• Coherence
• Quality
• Timeliness
• Granularity of the data

9. Changes in these areas could improve insight and allow the existing data to better meet user needs. We welcome the ONS proposals for a portal to signpost users to existing social care statistics, and want to see all producers of social care statistics take on the recommendations we have set out in letters to the relevant Head of Profession for Statistics following our detailed review of official statistics outputs as part of this review.

10. We will continue to work with a range of organisations to make the case for improvements to social care statistics. We hope to raise the profile of the  issues highlighted in this report and work towards parity of esteem between health and social care statistics.

11. Improved statistics can support policy makers who are developing proposals to reform delivery of adult social care, as well as individuals who will be able to hold government to account and make better informed decisions about the issues impacting their lives and their families.

Data and statistics on COVID-19 impacts on the care sector

12. Statistics on COVID-19 in the care sector – including care home outbreaks, the number of suspected COVID-19 cases in care homes, and registered deaths in care homes involving COVID-19 – are currently released through a variety of different reports including daily and weekly surveillance reports and within weekly registered death releases. These statistics start to provide a picture of the impacts on those receiving care and help decision makers to understand and manage COVID-19 within care settings. However, further analyses are needed to provide context and facilitate a better understanding of key areas for concern.

13. To further improve these statistics, we suggest producers continue collaborating to present a coherent picture of the impact of COVID-19 on those in care settings across the UK. For example, the ONS is collaborating with the Care Quality Commission in England and the Care Inspectorate Wales to publish early estimates of COVID-19 related deaths in care homes. We welcome these new data and efforts and recognise that producers are seeking to develop statistics provision in this area.

14. Producers also need to explain the wider context of COVID-19 and the large number of deaths for those in care settings. There is a need for information to contextualise the data and statistics on deaths in the sector as well as to support management of COVID-19.

15. Alongside this, producers need to understand and assess the impact of any changes in the circumstances and context of data sources, and any implications for use should be clearly explained. Within the varied landscape of statistics and data on those in care settings, producers should make the definitions within their outputs clear to users. For example, clearly identifying statistics as deaths involving COVID-19, deaths due to COVID-19, or deaths of those with a positive test result.

16. Producers should work closely with relevant parties, such as the Care Quality Commission, to understand and investigate any changes in the recording of COVID-19 on death certificates which may impact on the accuracy of the data on deaths in the care sector.

17. There is a need for producers to provide or enable regional comparisons where possible, with guidance and contextual information to support the interpretation of the statistics, as well as UK comparisons where possible. Guidance should be provided on whether the data from different countries of the UK can be compared to help users understand and interpret the statistics. The  similarities and differences between the country-level data should be clearly explained, particularly any differences in care provision, differences in the characteristics of the population of those receiving care, and data collection methods that could affect the ability to make comparisons.

18. The OSR has also published a full statement on data and statistics around the impact of COVID-19 on the care sector.

OFFICE FOR STATISTICS REGULATION, JUNE 2020


* Latest figures from HM Treasury show that public expenditure on personal social services in England (table 10.1 of that report) amounted to £24.5 billion in 2017/18, and this does not include the significant private expenditure on social care.