Office for National Statistics written evidence submission to the Women and Equalities Select Committee inquiry into the impact of the rising cost of living on women

Dear Ms Nokes, 

 I write in response to the Women and Equalities Select Committee’s call for evidence for their inquiry into the “Impact of the rising cost of living on women”.  

As the Committee is aware, the Office for National Statistics (ONS) is the  

largest producer of official statistics in the UK. We aim to provide a firm evidence base for sound decisions and develop the role of official statistics in democratic debate. As the UK’s National Statistical Institute, the ONS produces a wide range of economic and social statistics, including the latest data and trends about the cost of living and how this is affecting people in the UK.

 Since UK consumer price inflation peaked in October 2022, the cost of living in the UK has been fluctuating. To assist the Committee in understanding how these changes have impacted women, we have prepared a written evidence submission that provides a broad overview of the major after-effects of changes to the cost of living in the UK. This includes looking at the main drivers of rising inflation, food and beverage costs, energy costs, rental prices, among others.  

 This submission also details how data collected in the Opinions and Lifestyle Survey shows women are more likely than men to report difficulties in paying their energy bills and the unlikelihood that they will be able to save money in the future. Alongside this, we have provided analysis of the regional and national differences in how the cost of living has changed in recent months, as well as specifically looking at how those from the lowest income households have felt the effects. 

Changing cost of living

UK consumer price inflation (the rate at which prices faced by consumers change) began accelerating in Spring 2021 and peaked to a 40-year high of 9.6% in October 2022. Although rates are now falling, they have remained high in the year since. In the year to September 2023 the Consumer Prices Index including owner occupiers’ housing costs (CPIH)was 6.3%, the lowest rate since March 2022.

The main drivers of rising inflation over the last two years have included food and non-alcoholic beverages, housing and household services (including rental costs and household energy costs), and transport (including fuel costs).

For food and non-alcoholic beverages, the annual inflation rate to peaked at 19.2% in March 2023, the highest rate in over 45 years. Since then, the annual rate has eased for six consecutive months. Food and non-alcoholic beverage prices showed the first month-on-month price reduction in September 2023.

Annual inflation for motor fuels has been negative since March 2023 reflecting the fall in fuel prices from a peak last year, but the drag on headline inflation has eased as fuel prices levelled off and then started to pick up. The price of motor fuels fell by 9.7% in the year to September 2023, compared with a fall of 16.4% in the year to August, reflecting falling petrol and diesel prices over the last year.

Gas and electricity prices rose at 1.7% and 6.7% respectively in the year to September 2023. Between June and July 2023, gas prices fell at record rates of 25.2%. This was largely because of the lowering of the Office of Gas and Electricity Markets (Ofgem) price cap in that month.

Private rental prices paid by tenants in the UK have risen by 5.7% in the 12 months to September 2023. Recent analysis showed that private renters on a median household income could expect to spend 26% of their income on a median-priced rented home in England, compared with 23% in Wales and 25% in Northern Ireland, in the FYE 2022. Comparatively, housing purchasing affordability analysis has shown a clear pattern of house prices increasing faster than incomes and UK inflation. In the FYE 2022, for homes in England, average house price to household income ratio was 8.4 (meaning 8.4 years of median income to afford median house price) compared to 6.4 in Wales, 5.3 in Scotland and 5.1 in Northern Ireland.

The annual growth for regular pay (excluding bonuses) was 7.8% in June to August 2023, according to the latest earnings data. This is similar to recent periods and one of the highest annual growth rates since comparable records began in 2001. In real terms (adjusted for inflation), regular pay rose by 1.1% on the year.

The gender pay gap, measured using the Annual Survey of Hours and Earnings (ASHE), has been declining over time, and in April 2023 stood at 7.7%. The gap for full time employees is larger for those aged over 40, and for skilled trades occupations (15%) followed by process plant and machine operatives (14.3%). The gender pay gap is higher in all English regions than in Scotland (1.7%), Wales (5.6%) or Northern Ireland (negative 3.5%).

Insights from the Opinions and Lifestyle Survey

The ONS has published a variety of analysis on the impact of the rising cost of living across a range of personal characteristics including sex.

Most recently, the latest article in the roughly quarterly series, Impact of increased cost of living on adults across Great Britain, provided information from the ONS’s Opinions and Lifestyle Survey (OPN) during the period February to May 2023. The article detailed the proportion of adults in Great Britain reporting an increase in their cost of living, the actions they are taking as a result, or the proportion of adults experiencing difficulty affording household expenses (such as energy, rent or mortgage payments or food), by personal characteristics including sex, (see tables 1.1, 2.1, 3.1 and 4.1), household size (tables 1.12, 2.12, 3.12 and 4.12), parental status (tables 1.11, 2.11, 3.11 and 4.11) or region (tables 1.3, 2.3, 3.3 and 4.3).

Estimates in these tables show for example, that women (50%) appear more likely to report it was difficult (very or somewhat) to afford their energy payments than men (45%) and appeared less likely to report thinking they will be able to save in the next 12 months (36% among women, 44% among men).

Considering impacts on other groups of the population likely of interest to the committee, these estimates also show that whilst around 1 in 20 (5%) adults reported that in the past two weeks they had ran out of food and had been unable to afford more, this proportion appeared higher among groups including those; receiving support from charities (45%), living in a household with one adult only and at least one child (28%), receiving some form of benefits or financial support (21%), Mixed or Multiple ethnicity adults (14%), Black, African, Caribbean or Black British adults (13%), renters (14%) and disabled adults (9%).

Looking at regional differences amongst people with these and other characteristics has not been examined using this data source due to sample sizes being too small at this level of geography.

Regional and national differences

The ONS has published a variety of subnational statistics that reflect the geographic differences and the impact of the changing cost of living. Subnational data on this topic has largely focussed on housing, energy insecurity and food insecurity.

The latest article on private housing rental prices showed that prices paid by tenants has varied by English region and UK nation. Private rental prices in Northern Ireland increased by 9.3% in the 12 months to July 2023. This is higher than for other UK countries during the same period when prices rose by 5.2% in England, 6.5% in Wales and 5.7% in Scotland.

In the 12 months to September 2023, private rental prices rose by 5.6% in England, 6.9% in Wales and 6.0% in Scotland. Amongst the English regions, London’s annual rent price inflation was 6.2% in the 12 months to September 2023. This was the highest annual increase across the English regions. This was followed by the West Midlands where annual rent inflation (5.7%) was also above the England average annual rise (5.6%). The North East had the lowest annual increase at 4.7% during the same time period.

The ONS has also published recent analysis on monthly repayments for newly issued mortgages over the past year, because of rising interest rates increasing the cost of borrowing. The analysis is based on some key trends from our mortgage repayments calculator tool and includes variation across English regions and UK nations. Although mortgage rates differ, depending on the size of the loan relative to the value of the property being purchased, house price differences between regions has meant that increases to monthly mortgage payments have varied. In particular, London’s higher house prices have resulted in the largest monthly cost increases. Conversely, Northern Ireland’s lower house prices have resulted in the smallest nominal increases to monthly repayments.

In February 2023, the ONS published analysis on the characteristics of adults experiencing energy food insecurity in Great Britain. Adults in the North East, the East of England, and the North West were all more likely to report that they had experienced food insecurity than those living in London. The analysis also showed that there was no geographic difference between adults reporting some form of energy insecurity.

Impact on lowest income households

Between the FYE 2021 and FYE 2022, median household disposable income for the poorest fifth of the population decreased by 3.8% to £14,500; compared to 1.6% increase for richest fifth. The largest contribution to change in disposable income across all households is attributable to original income, driven by a decrease of 4.0% in the poorest fifth of people, compared with an increase of 5.4% in the richest fifth of people.

More specifically, the poorest fifth of people saw a 7.5% decrease in wages and salaries, while the richest fifth saw a 7.8% increase, and a UK wide increase of 3.2%. For the poorest fifth of people, income was further reduced by a real-term reduction in cash benefits of 2.6% (a nominal £80 increase) between FYE 2021 and FYE 2022, which was not fully offset by a reduction in taxes.

Table 1 shows the equivalised (accounting for household composition) household disposable incomes for some groups, as published within the Effects of Taxes and Benefits release. For non-retired one adult households (without children), where the household reference person was a woman, the mean household disposable income was significantly below the UK average. The disposable household income for non-retired one adult households with children was significantly below the mean UK average, however this group is not routinely split by sex of the household reference person. For retired one adult households (both with and without children), where the household reference person was a woman, the mean household disposable income was significantly below the UK average.

Table 1: Annual equivalised (accounting for household composition) household disposable income by household composition, UK, Financial Year Ending 2022

Equivalised Household disposable Income (£)
UK MeanOne adult household (all)One adult household (women)One adult household (men)
Non-retired Households (with and without children)41,200
Non-retired households (without children)39,50036,50041,800
Non-retired households (with children)23,100
Retired households (with and without children)30,90026,70025,00030,100

When comparing spending by the poorest fifth to the richest fifth for FYE 2022, the richest fifth of households’ total weekly expenditure was more than twice that of the poorest fifth of households (£811.20 and £329.80, respectively) . In comparison, mean household disposable income was six times greater in the richest fifth of households than the poorest fifth. The poorest fifth of households continued to spend the greatest proportion of their total expenditure (25%) on housing (net), fuel and power. This is largely because of spending on actual rentals for housing (24% of their total expenditure). Note, housing (net) does not include mortgage payments, this is because mortgage capital payments are not regarded as a consumable item in line and instead add to personal wealth, while interest payments are classified as “other” expenditure, in line with international standards.

We hope this provides some interesting insights for you and the rest of the Committee. Please do not hesitate to let us know if we can provide anything further.

Yours sincerely,

Mike Keoghan

Deputy National Statistician for Economic, Social and Environmental Statistics

Office for National Statistics written evidence to the Women and Equalities Committee inquiry into the escalation violence against women and girls

Dear Ms Nokes,

I write in response to the Women and Equalities Select Committee’s call for evidence for their inquiry into the escalation of violence against women and girls.

As the Committee will be aware, the Office for National Statistics (ONS) is the UK’s National Statistical Institute and largest producer of official statistics. We aim to provide a firm evidence base for sound decisions and develop the role of official statistics in democratic debate.

In this written evidence, we have outlined the ONS’s sources for crime statistics, our most recent publications on violence against women and girls (VAWG), and our plans to address known gaps in the data currently available.

Sources of ONS crime data

Our publications and data concern crime as it is experienced by victims, or as it is recorded by police. The ONS Centre for Crime and Justice publish figures on the levels and trends of crime in England and Wales primarily based on two sets of crime statistics: The Crime Survey for England and Wales (CSEW) which is a face-to-face victimisation survey, and police recorded crime data which is sent to us from the Home Office.

ONS crime publications and data

We regularly provide insight into the latest evidence and data on VAWG. Our latest figures for the year ending March 2023 show that, in the last year:

  • 7% of women compared with 3.2% men aged 16 years and over experienced domestic abuse;
  • 2% of women compared with 0.9% of men aged 16 and over experienced sexual assault;
  • 4% of women compared with 2.4% men aged 16 and over experienced stalking.

We also produce a number of dedicated releases on a range of crime topics linked to VAWG. For example, we included some questions on the Opinions and Lifestyle Survey (OPN) which asked people about their perceptions of personal safety and experiences of harassment in the last 12 months. The latest data from 2022 show that:

  • more women (27%) than men (16%) reported they had experienced at least one form of harassment in the previous 12 months;
  • women felt less safe than men in all settings after dark; 82% of women reported feeling very or fairly unsafe after dark “in a park or other open space, compared with 42% of men”.

Data from the Home Office Homicide Index for the year ending March 2019 to the year ending March 2021 also showed that 72.1% of victims of domestic homicide were female.

We also publish a number of detailed articles on domestic abuse and data tables which include figures on the prevalence of domestic abuse from the CSEW, police recorded crime and data from victim services. Our domestic abuse and the criminal justice system article[ contains data from the Ministry for Justice and Crown Prosecution Service (CPS) on the responses to and outcomes of domestic abuse-related cases in the criminal justice system.

Our annual homicide article and data tables include analyses of information held within the Home Office Homicide Index and contains detailed record-level information about each homicide recorded by police in England and Wales. The data tables include details on victims of domestic homicide.

We also publish a sexual offences publication and data tables which includes victimisation data from the CSEW, police recorded crime, and victim services.

Evidence and gaps

We work with a range of data suppliers, including victim services, to bring together data to provide an overall picture of victims and their experience, as well as to understand the evidence gaps. Our article “The lasting impact of violence against women and girls”, brought together VAWG data from various sources and victim testimonies to demonstrate the profound long-term effects of VAWG on survivors and people close to them.

To support the UK Government’s Tackling Violence Against Women and Girls Strategy, we published a violence against women and girls (VAWG) data landscape. The landscape is a single comprehensive list of data and evidence relating to VAWG from a range of different sources from across government, academia, and the voluntary sector. The landscape can be used to identify available data sources relating to a particular topic (e.g., perpetrators or honour-based abuse) as well as to identify the evidence gaps in the data.

We have also published a research update that provides a summary of our current and future research and publications relating to VAWG.

The ONS plans to release an update to both the VAWG data landscape and the research update in November 2023. We will share this with the Committee when it is published.

I hope this evidence is useful to the Inquiry. Please let us know if there is anything further we can provide.

Yours sincerely,

Mike Keoghan

Deputy National Statistician for Economic, Social and Environmental Statistics
Office for National Statistics correspondence with the Women and Equalities Committee on Black Maternal Health

Dear Ms Nokes,

I am writing to you and the Committee regarding the one-off evidence sessions on Black Maternal Health of 30 March and 13 July. During these, there was discussion of the Office for National Statistics (ONS) supply of data to the National Perinatal Epidemiology Unit (NPEU) for their work on Mothers and Babies: Reducing Risk through Audits and Confidential Enquiries across the UK (MBRRACE-UK). I hoped to clarify the ONS position and reassure the Committee.

We send data on live births, still births and maternal deaths (both linked and unlinked) on a regular schedule to the NPEU to assist them in their work. This includes quarterly extracts, which are provisional data, and final annual refreshes. NPEU also rely on other data sources and suppliers as well as the ONS.

Over recent years, we have improved the timeliness of the delivery of data as much as possible, given limiting factors such as death registration delays. However, recently we have not always been able to meet this improved schedule because of impacts of the pandemic; primarily a backlog of birth registrations which local registry offices have been working through.

At all times, we have kept NPEU informed about any delays, and we are committed to continuing to enable their important work. In addition, my team will be meeting with their director in early autumn to explore any further improvements that can be made.

Yours sincerely,

Emma Rourke

Interim Deputy National Statistician and Director General for Health, Population and Methods


Office for National Statistics oral evidence to the Women and Equalities Committee’s inquiry on unequal impact: coronavirus and the impact on people with protected characteristics

On Wednesday 13 May 2020 Liz McKeown, Director of Public Policy Analysis, Office for National Statistics gave oral evidence to the Women and Equalities Committee’s inquiry on unequal impact: Coronavirus and the impact on people with protected characteristics.

A transcript of which has been published on the UK Parliament’s website.

Related Links:

Office for National Statistics written evidence to the Women and Equalities Committee (May 2020)

Office for National Statistics written evidence to the Women and Equalities Committee’s inquiry on unequal impact: coronavirus and the impact on people with protected characteristics

Dear Ms Nokes,

I write in response to the Women and Equalities Select Committee call for evidence for the inquiry “Unequal impact: coronavirus and the impact on people with protected characteristics”.

The Office for National Statistics (ONS) produces data and statistics to support decision-makers in the UK and our trusted, impartial information is more important now than ever. The coronavirus illness (COVID-19) is a significant challenge for the UK and we are working to ensure that the UK has the vital information needed to respond. This means we will seek to ensure that information is provided faster, using new data sources and changing how our surveys operate, to ensure we provide necessary information as the situation unfolds.

In response to the Committee’s call for evidence, we have reviewed the data we have published relating to the impact of Covid-19 on people with protected characteristics. The following provides
a summary of the existing evidence we have on this issue and highlights some planned relevant future work.

From our recent publications to date, some of the key findings on the impact of the illness or the responses to it on specific protected characteristic groups include the following:

• As has been widely reported, deaths from Covid-19 are disproportionately affecting older age groups, with rates increasing significantly as age increases, starting from age 55 to 59 years in men and age 65 to 69 years in women. Death rates from Covid-19 are also significantly higher for men than women.
• Over a third of those living alone, and therefore vulnerable to the isolating effects of lockdown, are aged 70 and over, a group that is already more worried than the rest of the population that they or their family will be infected. This is also the age group that is more likely than the general population to regularly stop and talk to their neighbours and to rely on adults outside the home to provide them with food or essentials, activities which will have been affected by social distancing measures.
• Households headed by the youngest, those aged 16 to 34 years, were less likely to have sufficient financial funds to cover a drop in household employment income. We also find that younger workers were least likely to work from home prior to the lockdown period, which in part is driven by the occupations young people are employed in.
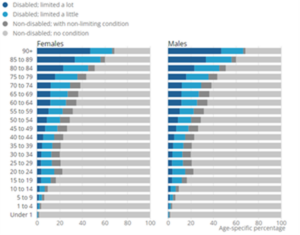
• Concerns over the pandemic are higher among disabled adults than non-disabled adults and, with more disabled adults self-isolating, there is evidence that it is having a negative
effect on their well-being. Since the start of lockdown, disabled adults are also significantly more likely to say that they are spending too much time alone than their nondisabled counterparts and are reporting much higher rates of loneliness.

The ONS is also planning the following new pieces of analysis to be published during May to increase the evidence base:

• Using new data linking Census 2011 to health data, we will publish Covid-19 deaths by ethnicity in early May, extending this analysis as more data become available to adjust for a range of different characteristics to add context to any differences found. The aim is then to extend this work to explore deaths from Covid-19, outcomes of hospital admissions and length of stay, by a range of characteristics including age, sex, disability, ethnicity and religion.
• Updated measures of personal and economic well-being will be published, including breakdowns for protected characteristic groups where possible. We will also be exploring the different characteristics that matter most to personal well-being and groups that are most susceptible to loneliness.
• We will publish separate articles, drawing on a range of different sources, including the redesigned Opinions and Lifestyle Survey, to explore the experiences of different protected characteristic groups in relation to Covid-19, specifically, differences between the sexes, differences among those of different ethnic groups and experiences of young people. The timeframe for the publication of these articles will depend on being able to pool a sufficient number of responses across waves to be able to draw robust conclusions.
• We are also exploring an analysis of workers and occupations that require the closest proximity to other people and therefore could be at higher risk of Covid-19 infection. We will look to publish analysis on these occupations by a range of protected characteristics. We are also looking to publish an article on the population and characteristics of key workers, including their protected characteristics where possible.
• More broadly we will continue to release labour market statistics and will be able to consider the impact of Covid-19 on different groups and their labour market status. We are also looking to produce analysis on those who could be considered key workers, including their characteristics and demographics.
• We will publish analysis on access to outside space and, separately, analysis on household composition and type of accommodation people are living in, including housing types, living conditions, tenure and cramped accommodation. Both pieces of work will include breakdowns by protected characteristic groups where possible.
• We are exploring the possibility of using provisional data from our suite of household
finance surveys to understand the impact on incomes during the early stages of the coronavirus emergency. With a focus on changes in income inequalities for those groups most impacted by changes in employment status alongside different household characteristics.
• By the end of May, the first estimates from the Online Time Use Survey will be available covering the period from 28 March to 4 April, which will explore how respondents in different protected characteristic groups spent their time over a 2-day period.

Alongside our immediate analytical plans, we also have plans in relation to new survey data sources, which include:

• Working with Oxford University, Manchester University and IQVIA, we have begun a Covid-19 prevalence/incidence of infection survey. Analysis will present a measure of population prevalence of infection, which will include breakdowns for protected characteristic groups where data allow.
• During May, we will be starting a telephone version of the Crime Survey for England and Wales, which will provide information on a variety of topics across a range of protected characteristic groups. Alongside questions on criminal victimisation, topics are likely to include; violence in a domestic setting, hate crime, experiences of threats or harassment and perceptions of the police and crime and will capture the period before the introduction of measures to tackle the Covid-19 outbreak as well as since then.
• ONS is working with NHS Digital and NatCen Social Research to develop a study of children and young people’s mental health and wellbeing during the COVID-19 outbreak. Subject to funding, this proposed online study in England will interview children and young people who took part in the 2017 Mental Health of Children and Young People study. It will collect information on children’s mental health and wellbeing and allow some basic breakdowns by ethnicity and sex.

As more data become available, we will continue to explore the impacts on different protected characteristic groups at a greater level of granularity, not only during the pandemic itself, but also
investigating the equalities impacts in the longer term. We would welcome exploring with the Committee the potential to collaborate and contribute to this evidence base and are keen to take
into account the Committee’s priorities when developing our future workplans in these areas.

I hope the Committee finds this evidence to be helpful. Please do not hesitate to contact me if I can be of any further assistance.

Yours sincerely,
Iain Bell
Deputy National Statistician and Director General for Population & Public Policy

Related Links:

Office for National Statistics oral evidence to the Women and Equalities Committee (May 2020)

Office for National Statistics written evidence to the Women and Equalities Committee’s inquiry on preparations for the 2021 census

Dear Mrs Miller,

While providing evidence at the Women and Equalities Committee on 6 February on preparations for the 2021 Census, Frankie Kay and I promised to provide further information on a number of areas. Most relate to our recommendations on questions for inclusion, and as I discussed at the Committee, our role is to ensure that we produce high quality estimates of the population. To assess topics for inclusion in the Census we set out criteria which we then use to assess existing and new questions. These criteria include user need and public acceptability.

This letter follows up on: intersex data and gender identity; maternity data; data for the Sikh community; Census outreach; the legislative process and the future of the Census.

Intersex data and the sex and gender identity questions

The Committee were interested in more detail on the testing and process carried out for collecting information on intersex in the 2021 Census.

The sex question in the Census is an essential variable with high levels of user need that feeds into population projections, decision-making, planning and resource allocation across central and local government. This data reports toward a protected characteristic in the Equalities Act 2010. However, we know that some individuals in the intersex population might still wish to identify as being intersex through the Census.

From the beginning of our consultation work in 2016 we actively sought out and invited engagement from intersex organisations, including Intersex UK and the UK Intersex Association (UKIA), and we have kept these two groups informed of our question development work. Since 2018 we have also had discussions with: DSD Families, Turner Syndrome Support Society, Educate and Celebrate, Living with CAH and Agender.

We tested a change to the sex question, notably the addition of a third category for ‘other’. We ensured those who are intersex were included as respondents in the testing and development of this question. Our testing identified a number of different views. Intersex organisations advised that responding to the sex question via a third category was potentially difficult as those who are intersex have often experienced stigmatisation and might not be comfortable with disclosing their sex, while some individuals noted that the current question was a barrier due to the binary categories. Testing found that, overall, the addition of a third option meant individuals were unclear how to answer and the quality of male and female data was reduced. Our stakeholder engagement activity also uncovered some very strong views around the acceptability of adding a third response option, and that the sex question should remain as a binary option.

While we recognise that intersex is not the same as gender identity, there is a free-text box on the gender identity question where an individual can write in ‘intersex’ if they would like, meaning that some data on intersex may be collected through the Census. There will be guidance to ensure those who wish to inform us they are intersex are able to do so and know how to. Our engagement with the intersex community has not shown any objection to our proposed approach.

For those who identify as non-binary, we have recommended adding a caveat to the sex question that a gender identity question will follow. This makes the sex question more acceptable to non-binary and transgender people. The gender identity question will include a write in response option where non-binary respondents can identify as such. We are currently developing our plans for the processing of sex and gender identity data across both paper and electronic versions of the questionnaire. These will build on previous methods, but also consider that the Census will be conducted predominantly online in 2021.

The Committee might also be interested to note that National Records of Scotland (NRS) published ‘Plans for Scotland’s Census 2021’ in September 2018, where they set out their current proposals for Scotland’s Census 2021. They announced that they were considering a change to the response options for the sex question, and that testing was continuing on a non-binary question which would allow people to record their sex as female, male or other.

The Scottish Parliament’s Culture, Tourism, Europe and External Affairs Committee published a report on the Census (Amendment) (Scotland) Bill on 7 February 2019. It stated: ‘the Bill has raised significant issues with regard to how the Census in 2021 will deal with questions regarding sex, gender identity and sexual orientation and the process of consultation which has underpinned policy development on these issues’.

The Culture, Tourism, Europe and External Affairs Committee noted that the approach in England and Wales in 2021 will be to continue with a binary sex question and that the Office for National Statistics (ONS) Equality Impact Assessment underlined the importance of the protected characteristic of ‘sex’ to ensure robust data-gathering. This view was also expressed by data users in evidence to this committee.

The Culture, Tourism, Europe and External Affairs Committee recommended that the mandatory sex question should remain binary to maximise response rates and maintain longitudinal consistency with previous Censuses.

Pregnancy and maternity data

The Committee asked for further detail on why pregnancy and maternity data would not be collected in the Census. The Census is a snapshot of the population every ten years, and accordingly there was little user need for this information from the Census specifically which came out of our consultation process. Even without specific questions, the Census is still a valuable source given those who have recently given birth should be identifiable. It does provide other insights as well: by combining the responses from several questions, we can see if the mother of a child under 26 weeks are in the same household. We can also identify from the employment status question whether an individual is on maternity or paternity leave.

As we discussed at the Committee, this is an area where administrative data is most useful. For maternities, we have the civil registration record of every birth and stillbirth that takes place (and is registered) in England and Wales. We also have birth notifications from the health service, which give gestation length, baby’s weight, ethnicity, and we link these to the birth registration to produce our statistics on births.

These data on essentially every birth and mother gives us a good basis for linking to other administrative or survey data to generate new insights. This could be health data about the mother, her pregnancy, delivery, and post-natal care. It could also be non-health data on things like income and employment before and after the pregnancy and birth.

We are in the process or exploring and acquiring new health and non-health administrative sources. Moreover, our health analysis team’s wider strategy is to explore the social, economic and environmental impacts on health, but also how health impacts these areas. There will be challenges with the administrative sources we acquire, but their acquisition in tandem with our existing data and analytical strategy, should allow us to explore research questions such as those around maternity and equality, without any need for Census data on pregnancy or maternity.

Survey of Gurdwaras

At the Committee we briefly discussed the survey of Gurdwaras. A possible survey of Gurdwaras was first mentioned at a meeting on 17 January 2018. The meeting was convened by ONS with leaders of the Sikh community to discuss how best to meet the data needs of the Sikh community in the 2021 Census. There were differing views between the Sikh leaders on whether a new tick-box for Sikh ethnicity was required in addition to the tick-box for Sikh religion. It was agreed that the meeting would reconvene in a months’ time and that in the intervening period, ONS would seek legal advice from the equalities perspective. It was also agreed that if, at the next meeting, there was still no obvious way through, a survey of Gurdwaras could potentially be a way forward. A covering letter and a survey was issued to Gurdwaras by the APPG for British Sikhs dated 31 January 2018. The first I was aware of the survey was when I received a letter from the APPG for British Sikhs with a copy of the survey attached on 12 February 2018. I neither saw nor commented on the survey prior to this date. On 19 February 2018, I replied to the APPG for British Sikhs to say it was my understanding that they would share material to support a potential survey, rather than sending a survey out directly. I explained there are important considerations to ensure surveys are unbiased, and that ONS would utilise our independent statistical assurance panel to assess whether the survey will provide unbiased results. It is standard practice in ONS to seek expert statistical methodological advice for survey work. The independent advice which ONS received on 27 February 2018 said that:

• the survey was likely to be a survey of Gurdwara leadership, rather than the wider community;
• the covering letter put a strong case for the inclusion of the ethnic question, and then asked for the survey to be returned. This is not conducive to the collection of independent statistical evidence; and
• if there is a positive response to the survey, that does indicate support of a “political” or “advocacy” nature from the leadership of Sikhs.

Despite these reservations, on 10 April 2018 and again on 31 May 2018, ONS requested the results of the survey so that it could take it into account in finalising its recommendations. An article was published in the Times on 23 July 2018 announcing the results of the survey. ONS received the results of the survey from the APPG for British Sikhs on 13 August 2018, although the letter was dated 27 July. The results showed that:

• Of 112 Gurdwaras who responded, out of 250 Gurdwaras who were sent a letter, all supported a tick-box;
• The response rate from the Gurdwaras was less than 45 per cent.
While ONS did not endorse the survey or provide comment in advance on methodology, we informed the APPG for British Sikhs that it would still form part of the information we used to make our final recommendations, as is the case for all information we receive.

Census outreach

The main aim of the Census community engagement programme is to improve responses, particularly among the key population groups.
The programme develops strategic partnerships with organisations in the community, the voluntary sector and local authorities. It is focused on building alliances based on a shared interest to ensure communities are represented in the Census. We also recognise local authorities’ knowledge and understanding of their areas and resident communities which will, as in 2011, be important to the success of the 2021 Census.

The 2011 Census showed that through the development of these partnerships, ONS could access established and effective networks and communication channels to disseminate messages and share content.

The budget for this outreach work funds a small in-house team of six permanent ONS staff, who identify and establish these strategic partnerships with local authorities and national community organisations. They deliver face to face engagement with organisations and individuals and have established partnership forums. For example, they recently attended a Nepali community forum to raise awareness of the Census and met Age UK to explore how we can best support more vulnerable people in society to complete their questionnaire. The majority of content and promotional materials they provide to partners is produced in-house.

From summer 2020, a network of 150 temporary local Census Engagement Managers will be in place to build on these links in local areas. In addition to their work supporting operations, much of their focus will be on engagement with key population groups that are less likely to respond without support.

Our experience from the 2011 Census was that many local authorities, national and local communities, networks and organisations were motivated to help and conducted many engagement activities themselves, which contributed to the success of the Census. The outreach work aligns closely with our plans on engagement through the Census field staff and our communications campaign.

Legislative process

I promised the Committee I would provide a fuller explanation of the parliamentary process for the Census. We are working closely with the Cabinet Office on the legislation needed to deliver the 2021 Census as set out in the White Paper, with questions on sexual orientation and gender identity. Options include the potential for primary legislation, as was discussed in the evidence session, and which is the approach which Scottish Parliament are taking, however I should be clear to the Committee that the approach to be taken for England and Wales has not yet been finalised.
The Committee asked specifically about the scope for Parliament to amend Census questions. All Census legislation remains subject to drafting, however the content and conduct of the Census are each subject to approval by Parliament through a Census Order and subsequent Regulations.

The Census Order is an unusual statutory instrument, as the Census Act 1920 gives Parliament scope to amend certain aspects of the Order, but not others. The Census Order sets the date for the Census, as well as what information will be required from respondents, which must all relate to a list of topics that are listed in the Schedule to the Census Act 1920. The list in the Schedule is as follows:

1. Names, sex, age
2. Occupation, profession, trade or employment
3. Nationality, birthplace, race, language
4. Place of abode and character of dwelling
5. Condition as to marriage (or civil partnership), relation to head of family, issue born in marriage
5a. Religion
6. Any other matters with respect to which it is desirable to obtain statistical information with a view to ascertaining the social or civil condition of the population

The Census Act 1920 prescribes that only matters falling under paragraph 6 of the Schedule (‘Any other matters with respect to which it is desirable to obtain statistical information with a view to ascertaining the social or civil condition of the population’) are subject to the affirmative procedure and may be amended. Matters falling under paragraphs 1 to 5A of the Schedule cannot be amended.
The Census Regulations follow on from the Order and expand on it with further detail, but are only subject to the negative procedure and are not amendable.

The Order for the 2021 Census remains subject to drafting, however further to the Act itself, the 2009 Census (England and Wales) Order as laid before Parliament in draft provides a general guide to where there is precedent for questions to be amendable and where not. At this stage, it is too early to say how new questions will be treated in the Order.

The Census beyond 2021

Decision-makers increasingly need more granular and timely national and local data on the size, characteristics and changing dynamics of their population to build better services, transport links, schools, hospitals, housing etc. We spoke at the Committee about our work to transform population statistics by putting administrative data at the heart of the system in 2020. This and the 2021 Census are key to laying the foundation for us fully transforming to a statistical system based firstly on administrative data supplemented with surveys.

We will consult with users on how administrative data can come to the fore of the statistical system and ensure we are ready to make recommendations to Government in 2023 on the future of the Census. A research engagement report on the transformation of population and migration statistics has been published in January 2019.

An Administrative Data Census would produce population and migration statistics using data which other government departments already collect, for example, NHS patient registration. The latest assessment on progress towards this, published in July 2018, reported that ONS is making good progress but that further work needed to be done. Since then, we have developed a methodology for estimating household size and household composition from admin data and published a wider range of research into producing population characteristics, including new outputs on new mothers’ income, internal migration, household composition, ethnicity, small-area income distributions, commuting flows and labour market status.

We intend to produce new research outputs on:
• Educational qualifications (by end-2019);
• Ethnicity for small areas (using integrated Census and admin data);
• Overcrowding estimates using Valuation Office Agency (VOA) data and research into use of property type, with edit and imputation methods for number of rooms in preparation for the 2021 Census;
• and our progress on transformation of the population and migration statistics system.

We also hope to produce research outputs on income distributions (including Self-Assessment data) and labour market status by the end of 2019 if the data required becomes available. We will continue to keep the Committee informed about this work.

I hope the Committee finds this note helpful. We will of course keep you updated on our plans for the 2021 Census as they develop, and I would be very happy to have a meeting with yourself and any other members of the Committee to discuss this letter in more detail. Please do not hesitate to contact me if you have any further questions.

Yours sincerely,

Iain Bell
Deputy National Statistician and Director General, Population and Public Policy Office for National Statistics

Office for National Statistics oral evidence to the Women and Equalities Committee’s inquiry on preparations for the 2021 Census

On Tuesday 6 February 2019, Iain Bell, Deputy National Statistician for Population and Public Policy, Office for National Statistics and Frankie Kay, Director of Census Transformation, Office for National Statistics gave evidence to the Women and Equalities Select Committee as part of their inquiry regarding Preparations for the 2021 Census.

A transcript of which has been published on the UK Parliament’s website.

Office for National Statistics update to the Women and Equalities Committee’s inquiry on the Race Disparity Audit

Dear Mrs Miller,

In my response to the Committee’s report on the Race Disparity Audit of 7 August, I agreed that we would keep the Committee updated on the progress of the Office for National Statistics (ONS) equalities data audit.

I am pleased to inform the Committee that today the Centre for Equalities and Inclusion have published our final report on this which considers the state of existing evidence across all the protected characteristics specified in the Equality Act 2010. As described in my previous letter, we convened a working group to assess the extent of the current evidence base from the range of sources available; this group included representatives from across government, including the Government Equalities Office, the Equality and Human Rights Commission and the Race Disparity Unit.

Our work on the audit together with discussions with users illustrated a number of issues with the existing evidence base. These relate to accessibility, coverage and comprehensiveness of the data, granularity, harmonisation and inclusiveness in data collection and reporting. While some of these issues reflect gaps in the evidence base in relation to specific areas for protected characteristic groups, some reflect a lack of even basic information on specific groups.

This audit is our starting point. We will continue work to include additional sources and to ensure its comprehensiveness. Our next steps will be to consider the findings with our partners across government, academia, business and the third sector, to prioritise and take appropriate action. We will also be considering ways to make the audit more accessible to users.

I will continue to keep the Committee updated on our progress and would welcome your feedback, in particular regarding how the Centre may take into account the Committee’s priorities when developing our future workplans. Please do not hesitate to contact me if I can be of any further assistance.

Yours sincerely,

Iain Bell Deputy National Statistician and Director General, Population and Public Policy

Related links:

ONS response to the report (2018)

ONS oral evidence (2018)

ONS written evidence (2018)

Office for National Statistics response to the Women and Equalities Committee’s report on the Race Disparity Audit

Dear Mrs Miller,

I am writing to offer the Office for National Statistics (ONS) response to the Women and Equalities Committee report on the Race Disparity Audit.

The Committee made one recommendation to ONS:

“The Equality and Human Rights Commission and the Office for National Statistics should work together to provide updated guidance for public bodies, service providers and employers on how to collect consistent ethnicity data and how public sector bodies should use that data to assess their compliance with the Public Sector Equality Duty. (Paragraph 26).”

ONS welcomes this report and its recommendations. We look forward to building on our existing relationship with the Equality and Human Rights Commission (EHRC) and working closely with them to improve the coherence of official statistics on ethnic group. We are committed to developing improved guidance to accompany the harmonised principle for ethnic group and encouraging its use across the Government Statistical Service (GSS).

We are currently developing plans for a programme of work to review the harmonisation guidance, and work to embed this across the GSS. The timing of this will take into account the development of questions for the 2021 Census, and will include an impact analysis of updating the harmonised principle in line with any changes made to the 2021 Census question.

To assist, ONS have recently recruited a topic lead for Ethnicity, Identity, Language and Religion who will create a knowledge base, build expertise and maintain a network of stakeholders and partners, including the GSS, EHRC and Race Disparity Unit (RDU).

ONS also noted recommendations 2, 3 and 6 within this report.

“Significant effort has gone into collecting and publishing the data on the Ethnicity Facts and Figures website. We welcome the commitment from the Cabinet Office to continuing to expand the published data sets. The Cabinet Office should publish a schedule for the addition of new data sets to the website and planned updates to the data already held on the site. We recommend that particular efforts are put into ensuring that data sets are robust enough to be comparable, including over time, and that regional variations can be seen. In future, the Government should consider including non-governmental sources of data in this resource. (Paragraph 17).”

“The Government, led by the Cabinet Office, should adopt the same categories as are used in the Census as the minimum standard for data collection on ethnicity across Government departments, and work with individual departments to ensure that this happens in all official data sets and administrative data in the public services for which they are responsible. At present this means using the ‘18+1’ categories, but should the categories change for the 2021 Census, the Cabinet Office should take advice on how best to ensure comparability of data sets over time. (Paragraph 25).”

“We recommend that the Government publish an action plan to improve the consistency and robustness of the data it collects on the basis of ethnicity, to be implemented within 12 months. In the longer term, the Government should ensure that key data can be disaggregated to allow factors such as gender, age, region, socioeconomic status and religion and belief to be taken into account alongside race and ethnicity. (Paragraph 33).”

We welcome these recommendations, and wanted to make the Committee aware of complementary work currently underway at ONS. We continue to work closely with the RDU to improve understanding and communication of disparities. Alongside the review of harmonisation guidance, we are developing plans to identify and engage with departments who are not using the current harmonised ethnic group question and encourage its adoption.

We are currently finalising our recommendations for the 2021 Census, which will inform a Government White Paper later in the year. Our recommendations for the 2021 Census questions will be reviewed by the Ethnic Group Assurance Panel, which consists of data users and experts from across government and academia to ensure user needs are met. Once the content of the Census has been finalised, ONS will consult with key stakeholders across the GSS to understand the impact of updating the harmonised principles and guidance and also, how best to use data from across Government for ongoing monitoring of equalities issues without increasing burdens on citizens and public services.

This also links to data development work underway within our Inequalities Centre of Expertise, where we are working across government, academia and the third sector to make better use of all existing data sources and to develop new ones. From this, we will enable consideration of the intersectionality of different protected characteristics with one another, of socioeconomic status, at different levels of geography and for people who are at higher risk of harm, abuse, discrimination or disadvantage, e.g. carers, the homeless, refugees and asylum seekers.

Linked to the Inequalities Centre of Expertise is the audit of inequality data, also mentioned within your report. As part of the audit, ONS is aiming to capture all relevant sources of data on the protected characteristics, including non-governmental sources. A working group, which will include representatives from across government and the RDU, is being established to consider the outcome of the audit and to assess the extent of the current evidence base from the range of sources available.

Finally, we noted recommendation 11:

“The inter-ministerial group has the potential to provide the kind of high-level oversight that is needed, but its work needs to be informed by subject-specialist input on data collection and analysis and on race equality. We recommend that the Office for National Statistics be invited to attend the inter-ministerial group as observers to provide advice to the group. (Paragraph 44).”

ONS would be happy to observe and provide advice on the collection and analysis of data to the interministerial group on racial disparity. We will be sure to keep the Committee updated on our progress.

Yours sincerely,

Iain Bell

Deputy National Statistician and Director General, Population and Public Policy Office for National Statistics

Related links:

ONS update to the committee (2018)

ONS oral evidence (2018)

ONS written evidence (2018)

Office for National Statistics oral evidence to the Women and Equalities Committee’s inquiry on the Race Disparity Audit

On 7 February 2018 Iain Bell, Deputy National Statistician and Director General for Population & Public Policy, gave evidence to the Women and Equalities Committee’s Race Disparity Audit inquiry.

A transcript of which has been published on the UK Parliament’s website.

Related links:

ONS update to the committee (2018)

ONS response to the report (2018)

ONS written evidence (2018)