Methods
Participants
The consultation received a total of 185 responses:
- 100 responses (54%) were from individuals
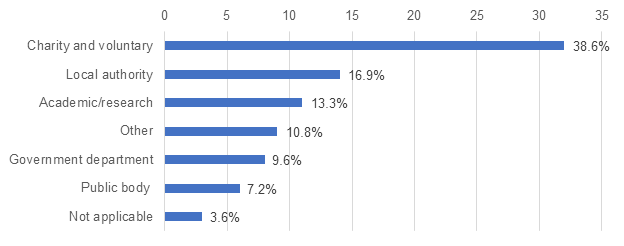
- 83 responses (45%) were from organisations (outlined in Figure 1)
- 2 responses (1%) did not answer this question
Source: UK Statistics Authority Inclusive Data
Research design
The consultation survey was made up of four sections (for a full list of consultation questions see Annex A.
- “About You” asked about participants and their interest in inclusive data and evidence
- “Current Data or Evidence” collected views on what is currently measured, how it is measured, and in what detail
- “Data and Evidence Accessibility” explored views on how accessible data and evidence currently are and how clearly they are presented
- “Making Improvements” collected suggestions for how improvements could be made and learning from what is already working
Online responses were gathered, with:
- 178 (96.2%) responses submitted via the online portal, Citizen Space
- 7 (3.8%) responses submitted via email
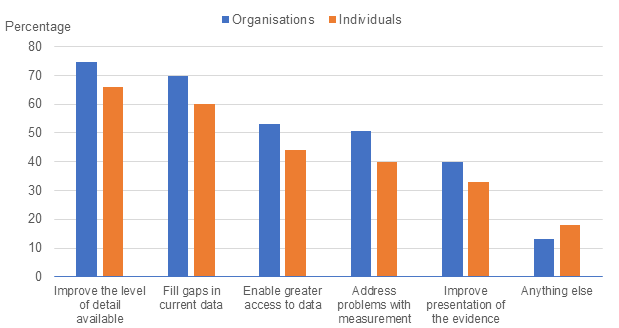
Participants were given a range of possible improvements and asked to select which they would like to see implemented to address the issues they had experienced with data and evidence. They could select multiple options. The most popular responses to this question from across both groups (see Figure 1) were:
- to “Improve the level of detail available”, with:
- 62 responses (75%) from organisations
- 66 responses (66%) from individuals
- “Filling data gaps”:
- 58 responses (70%) from organisations
- 60 responses (60%) from individuals
Responses in the accompanying textbox were included in the theme-based analysis.
Source: UK Statistics Authority Inclusive Data
Approach to analysis
Two approaches were used to analyse the findings:
- qualitative theme-based analysis for textbox responses
- quantitative analysis for closed or tick box responses
The theme-based analysis involved developing inductive codes (or “labels”) for the responses to each question, which were then grouped into common themes and refined as the coding process continued. To ensure reliability and consistency of coding, ongoing discussions took place between coders.
Quotes from participants have been included in this report to illustrate the findings in their own words and to give additional context and clarity.
Participants were asked if they consented to their name being published. For those who consented, the organisation name is shown next to the quote. Where organisations did not provide consent, either by declining or not answering the question, quotes have been attributed to the organisation’s sector where possible. Names of individuals have not been used, though quotes derived from individual participant responses are labelled as such.
Back to top