Dear Lord Forsyth,
I write in response to the Economic Affairs Committee’s call for evidence for its inquiry, Employment and coronavirus (COVID-19).
As the Committee will be aware, the Office for National Statistics (ONS) is the UK’s National Statistical Institute, and largest producer of official statistics. We aim to provide a firm evidence base for sound decisions and develop the role of official statistics in democratic debate.
We have focused our evidence on the impact of COVID-19 on the labour market and what our initial statistics on industries affected, hours worked and changes to working practices are illustrating.
We anticipate that our analysis will track the long-term effect of the coronavirus pandemic on the Labour Market for some time and would be happy to continue to keep the Committee updated.
I hope this evidence is helpful to the Committee. Please do not hesitate to contact me if I can be of any further assistance.
Yours sincerely,
Jonathan Athow
Office for National Statistics written evidence: Employment and COVID-19
Executive Summary
- Early estimates for September 2020 suggest that there is little change in the number of payroll employees in the UK; up 20,000 compared with August 2020. Since March 2020, the number of payroll employees has fallen by 673,000; however, the larger falls were seen at the start of the coronavirus pandemic.
- Data from our Labour Force Survey show the employment rate has been decreasing since the start of the coronavirus pandemic, while the unemployment rate and the level of redundancies have been increasing in recent periods.
- Total hours worked, while still low, show signs of recovering and had a record increase on the latest quarter. There are also fewer people temporarily away from work.
- Vacancies also show signs of a recovery. After record-low vacancies in April to June 2020, there has been an estimated record quarterly increase of vacancies in July to September 2020, but they remain below the pre-coronavirus pandemic levels.
- Annual growth in employee pay strengthened in August 2020 as employees continued to return to work from furlough; this followed strong falls in months since April when growth was affected by lower pay for furloughed employees, and reduced bonuses.
- The Claimant Count increased in September 2020, reaching 2.7 million; this includes both those working with low income or hours and those who are not working.
- The ability to work from home varies by occupation, with occupations requiring higher qualifications and experience more likely to provide the opportunity to homework than manual occupations. 69.6% of professional occupations did some working from home in April 2020, compared with 18.9% of skilled trade occupations.
- The amount of homeworking undertaken also varies significantly between regions. Working from home during the coronavirus pandemic is more common in London, where 57.2% reported home working, than in the West Midlands, where just over one-third (35.3%) did some homeworking.
Unemployment before pandemic
Unemployment measures people without a job who have been actively seeking work within the last four weeks and are available to start work within the next two weeks. The unemployment rate is not the proportion of the total population who are unemployed. It is the proportion of the economically active population (those in work plus those seeking and available to work) who are unemployed.
The UK unemployment rate for the period June to August 2020 was estimated at 4.5%. This is 0.6 percentage points higher than a year earlier and 0.4 percentage points higher than the previous quarter.
Estimated unemployment rates for both men and women aged 16 years and over have generally been falling since late 2013 but have increased over recent periods.
For men during the period June to August 2020, the unemployment rate was 4.9%, 0.8 percentage points higher than a year earlier and 0.7 percentage points higher than the previous quarter. For women, it was 4.0%, 0.3 percentage points higher than a year earlier and 0.1 percentage points higher than the previous quarter.
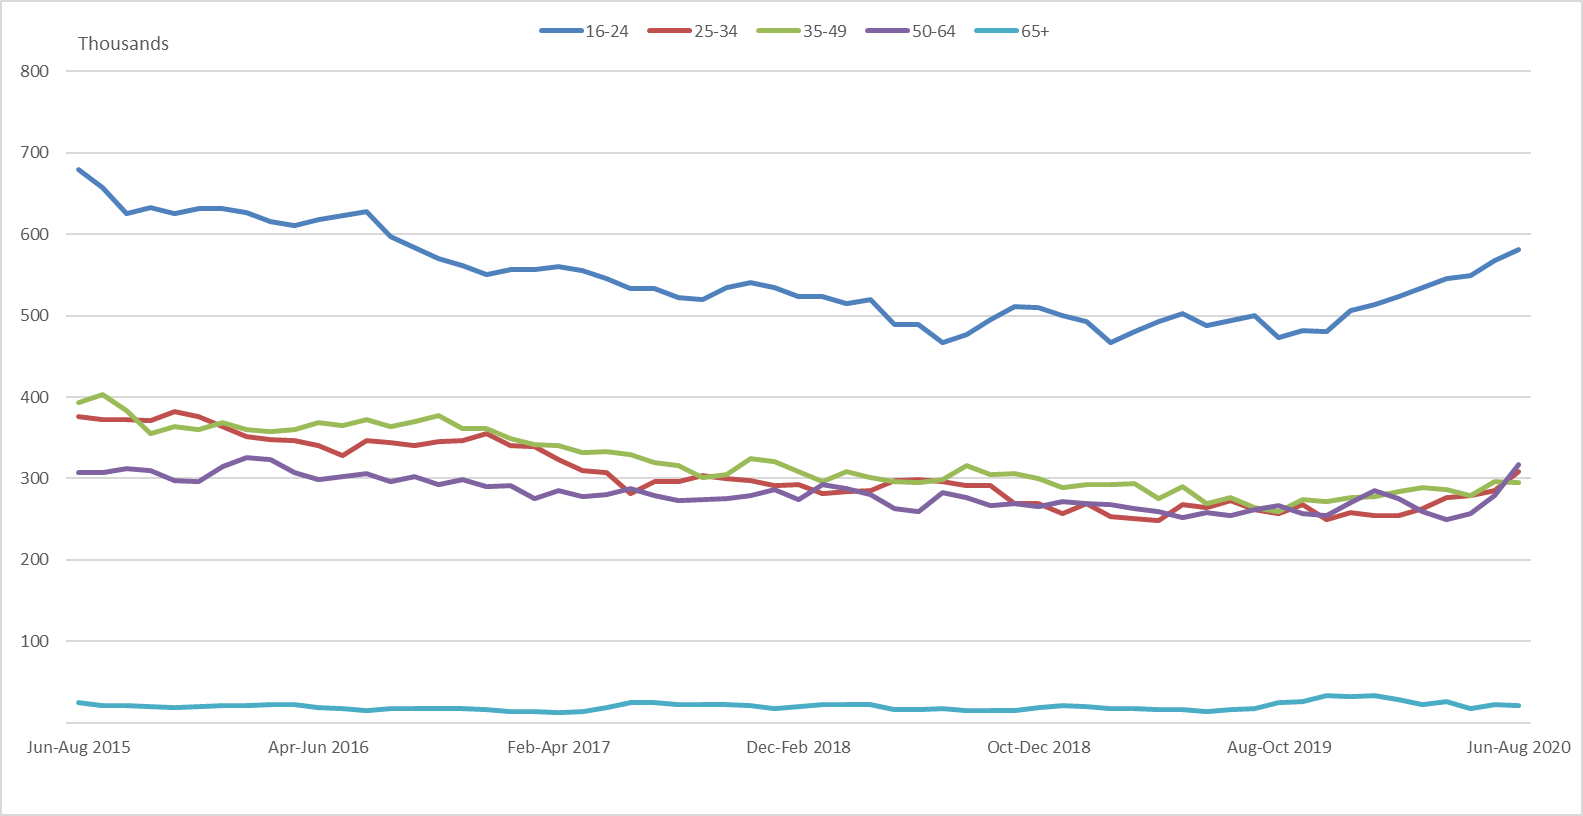
The annual increase in unemployment was driven by unemployed people aged under 25 years (up 87,000).
Figure 1: Unemployment in the UK by age (aged 16 years and over), seasonally adjusted, between June to August 2015 and June to August 2020
Source: Office for National Statistics – Labour Force Survey. For a more accessible version, please visit our accessibility policy.
The immediate impact on the Labour Market due to COVID-19
The ONS statistics on the labour market include both detailed and less timely survey data from the Labour Force Survey, and more up to date indicators, including administrative data from HM Revenue and Customs and the Department for Work and Pensions.
Early indicators for September 2020 indicate that the number of payroll employees fell by 2.3% compared with March 2020. In September, 673,000 fewer people were in paid employment than in March 2020 and 20,000 fewer than in August 2020. The largest falls were seen at the start of the pandemic and while the number of payroll employees is still falling the decline is slowing. Flows analysis suggests that the falls in June to August are largely due to fewer people moving into payrolled employment.
Figures for June to August 2020 show an increase in the unemployment rate and the number of redundancies continue to increase, while the employment rate continues to fall. Over the quarter, there has been a large decrease in the number of young people in employment, while unemployment for young people has increased. While redundancies were still historically low, the annual changes are the largest seen since 2009 and the quarterly change is the largest on record.
The number of people who are estimated to be temporarily away from work includes furloughed workers, those on maternity or paternity leave and annual leave. Prior to the coronavirus pandemic there was on average 2 to 2.5 million people temporarily away from work. The number of people temporarily away from work rose to almost 7.3 million people in April to June 2020 but has fallen to 6.4 million people in June to August 2020.
Meanwhile, the number of vacancies available have increased, showing a record quarterly increase of 144,000, in the latest period, driven by the smaller businesses, some of which are reporting taking on additional staff to meet COVID-19 guidelines. However, vacancies remain around 40% lower than the pre-pandemic level.
Annual growth in employee pay strengthened in August 2020 as employees continued to return to work from furlough; this followed strong falls in months since April when growth was affected by lower pay for furloughed employees, and reduced bonuses. For the sectors of wholesaling, retailing, hotels and restaurants, and construction, where the highest percentages of employees returned to work from furlough, there was improvement in pay growth for August 2020, but growth remains negative.
Labour Force Survey (LFS) estimates of self-employment shows a sharp fall over the quarter, which is not reflected in employees. There was a decrease of 240,000 on the quarter to 4.56 million people, the number of employees in employment continues to increase by 92,000 on the quarter to 27.90 million for June to August 2020.
Regional Labour Market
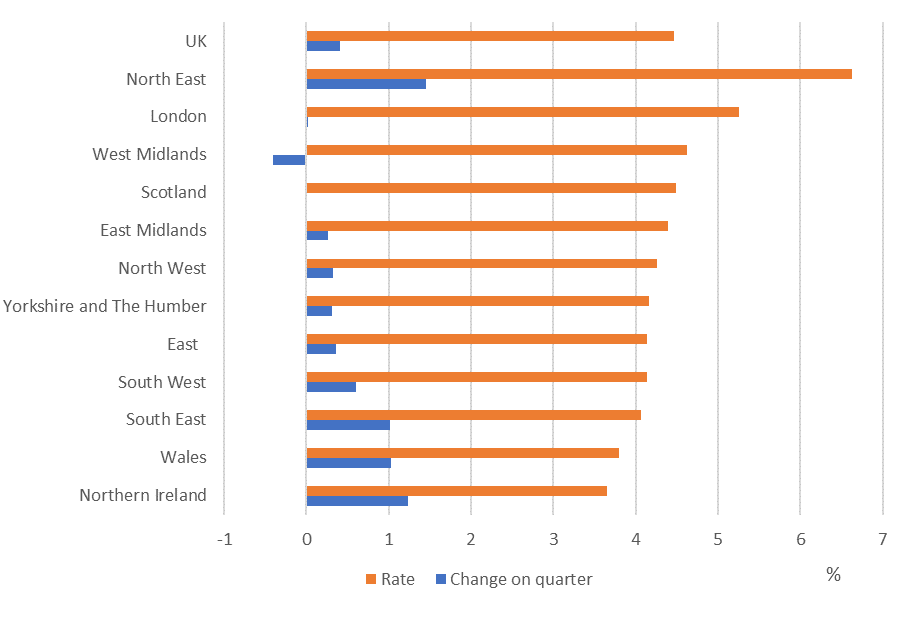
Looking at regional breakdowns, for the three months ending August 2020, the highest employment rate estimate in the UK was in the South East (79.1%) and the lowest was in Northern Ireland (70.6%). The UK region with the highest unemployment rate estimate for June to August 2020 was the North East at 6.6%. The region with the lowest estimated unemployment rate was Northern Ireland at 3.7%. This was followed by Wales at 3.8%.
Figure 2: Unemployment rates by UK region, seasonally adjusted, June to August 2020.

Source: Office for National Statistics, Labour Force Survey. For a more accessible version, please visit our accessibility policy.
Hours Worked
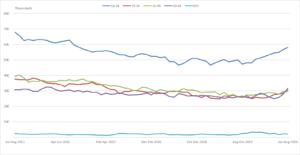
Total actual hours worked in the UK remain low, down 158.2 million, or 15.1%, on the year, showing the impact of furloughing on the labour market. However, the latest figures show some signs of recovery, between March to May 2020 and June to August 2020, total actual weekly hours worked in the UK saw a record increase of 20.0 million, or 2.3%, to 891.0 million hours. Looking at average actual weekly hours, this fell by 4.8 hours on the year to 26.3 hours. This is a recovery from the record low of 25.8 in April to June 2020.
When looking at our experimental weekly data, please note these are based on old weighting methodology therefore results are likely to be revised when figures are next updated on 10 November. We saw the largest falls in average actual weekly hours during the week commencing 23 March, which is the week in which lockdown measures were introduced. This fall was most evident for those who work part-time and for the self-employed. The fall in average actual weekly hours continued throughout the weeks in April, however since May we have seen hours for all groups start to increase slowly, although we are yet to see any group reach their pre-lockdown level. Self-employed hours have been more volatile than employee hours throughout the lockdown period and is not yet back in line with employee hours as was seen pre-lockdown.
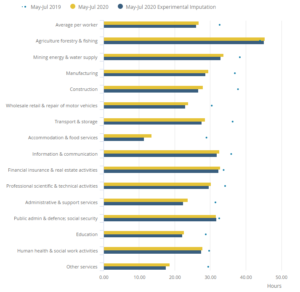
Average hours per worker from the LFS have fallen significantly when compared to the same period in 2019, which isn’t surprising given the impact of the pandemic. However, imputation used for the LFS was not designed to deal with the changes experienced in the labour market in recent months. Experimental work with adjusted methodology suggests that during the early stages of lockdown we were understating the full extent of the reduction in hours. However, now that hours are increasing, this has reversed so that the experimental methodology now suggests the actual number of hours are approximately 2.2% higher than stated.
Figure 3, based on data for May to July 2020 and using the old weighting methodology (latest data available), shows the industries that experienced the largest reduction in hours because of the coronavirus pandemic are also those where this reduction is most understated. For example, using this adjusted imputation methodology, the hours worked in accommodation and food service activities decrease by a further 2.1 hours compared with the original imputation method, to an average of 11.4 hours a week in May to July 2020.
Figure 3: Average actual weekly hours worked by industry (people aged 16 years and over), not seasonally adjusted, between May to July 2019 and May to July 2020
Source: Office for National Statistics – Labour Force Survey. For a more accessible version, please visit our accessibility policy.
Impact on sectors
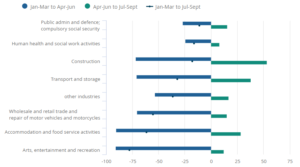
Industrial breakdown of the labour market can be seen across several of our labour market sources which all show that the impact of COVID-19 varied by sector. Figure 4 looks at the latest vacancies series where the “Arts, entertainment and recreation” sector struggled the most during the pandemic, with vacancies in August 2020 around 78.2% lower in July to September compared to January to March 2020. Accommodation and food services” also saw a large fall of 90.4% between January to March 2020 to April to June 2020, however it has seen a stronger recovery in the latest quarter than “arts, entertainment and recreation” and estimated vacancies are 61.9% lower than January to March 2020. “Construction” and “transport and storage” sectors are showing the biggest signs of recovery, both saw large quarterly falls in vacancies at the start of the pandemic in April to June 220 (71.7% and 70.7% respectively). Construction in particular has recovered well with estimated vacancies in the latest quarter 18.2% lower than January to March 2020.
Figure 4: Three-month average vacancies in the UK, seasonally adjusted, between January to March 2020 and July to September 2020; index January to March 2020=100, difference in percentage points compared with January to March 2020
Source: Office for National Statistics – Vacancy Survey. For a more accessible version, please visit our accessibility policy.
Figure 5: Changes in the number of jobs in the UK, seasonally adjusted, March 2020 to June 2020
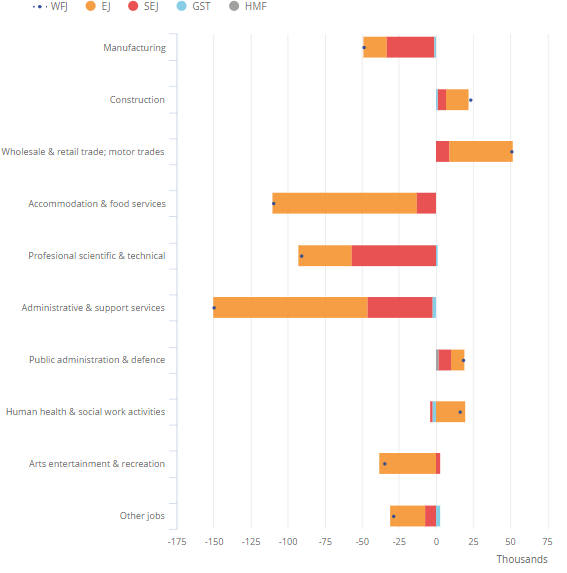
Source: Office for National Statistics – Monthly Wages and Salaries Survey. Acronyms used in chart: workforce jobs (WFJ); employee jobs (EJ); self-employed jobs (SEJ); Government Supported Trainers (GST); and HM Forces (HMF). For a more accessible version, please visit our accessibility policy.
Average weekly earnings estimates are based on the pay period including the last week of each month. Pay estimates are based on all employees on company payrolls, including those who have been furloughed under the Coronavirus Job Retention Scheme (CJRS).
Between June to August 2019 and June to August 2020, average pay growth varied by industry sector (Figure 6). The public sector saw the highest estimated growth, at 4.1% for regular pay. Negative growth was seen in the construction sector, estimated at negative 5.3%, the wholesaling, retailing, hotels and restaurants sector, estimated at negative 1.8%, and the manufacturing sector, estimated at negative 0.9%. This is, however, an improvement on the growth rates during May to July 2020.
Figure 6 also includes estimates of annual growth in regular pay for the single month of August 2020. For the construction, manufacturing, and the wholesaling, retailing, hotels and restaurants sectors, the August 2020 estimate of annual growth is notably higher than for the three-month average June to August 2020.
This pattern of pay growth is closely linked to the proportion of employees who are furloughed and the extent to which employers have topped up payments received for these employees under the CJRS. The ONS has published estimates of approximately 12% of the workforce on partial or full furlough leave during 24 August to 6 September 2020, with the arts, entertainment and recreation sector, and the accommodation and food service activities sector having the highest proportions of furloughed workers, at 41% and 29% respectively. These industries also showed 10% of the workforce that were still on partial or full furlough leave returned from leave in the last two weeks.
Figure 6: Annual growth in Great Britain nominal average weekly earnings excluding bonuses by sector, seasonally adjusted, May to July 2020 compared with June to August 2020 and August 2020
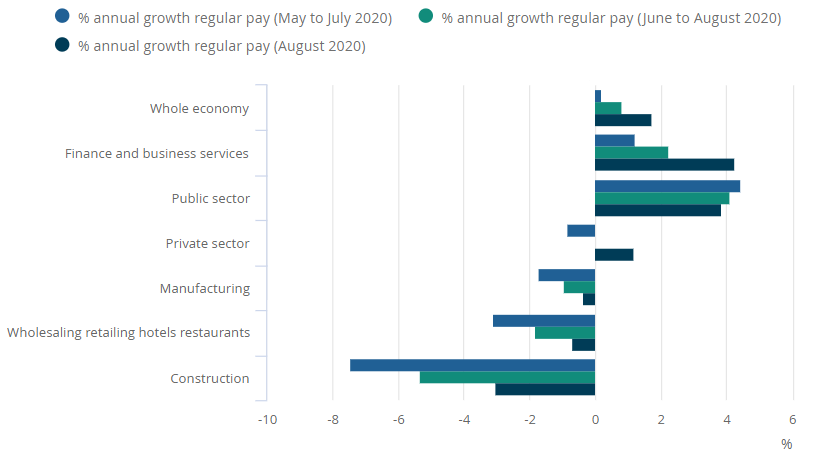
Source: Office for National Statistics – Monthly Wages and Salaries Survey. For a more accessible version, please visit our accessibility policy.
Figure 7 shows, by lower-level industry, average weekly employee pay in May 2020 and the percentage change in pay compared with May 2019. Figure 7 indicates that the three lowest-paid industries: accommodation and food service activities, the retail trade and repairs industry, and the arts, entertainment and recreation industry, all saw falls in pay compared with May 2019.
This is closely linked to differing numbers of employees being furloughed across industries (as indicated by HMRC data published on 11 June and ONS estimates published fortnightly), affecting the numbers of hours worked, as shown by LFS estimates. The decline in pay received by employees, especially those in lower- paid jobs, may contribute to increases in benefits claims caused by decreased household income.
Figure 7: Average weekly earnings excluding bonuses and annual percentage pay growth in Great Britain by industry, May 2020
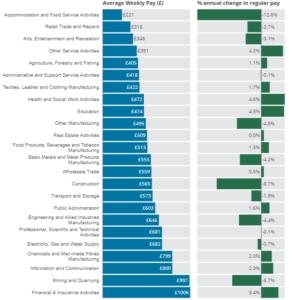
Source: Office for National Statistics – Monthly Wages and Salaries Survey. For a more accessible version, please visit our accessibility policy.
People who could potentially move into unemployment
Increases in unemployment are matched by decreases in numbers in other groups of people who are out of work and could potentially be seeking employment
These groups include:
- employees who, because of the impact of the coronavirus pandemic, have reported that they are temporarily away from work and not getting paid
- self-employed people who are temporarily away from work but not eligible for the Self-Employment Income Support Scheme (SEISS)
- people who are economically inactive as they are not currently looking for work but may look for work in the future if circumstances change.
Please note that the figures below are based on the old weighting methodology of the LFS, they will be updated on 10 November. Between April to June 2020 and May to July 2020, the number of people in these groups decreased from 2.13 million to 2.03 million (Figure 8). This decrease in the number of people who are around the fringes of unemployment coupled with the observed increase in unemployment suggests that some of the people who could have potentially been seeking employment in the previous period (April to June 2020) are seeking employment in May to July 2020.
Figure 8: Economically inactive who may seek employment, those away from work because of the pandemic and not getting paid, and all unemployed (aged 16 years and over), not seasonally adjusted, April to June 2020 and May to July 2020
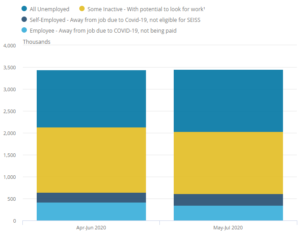
Source: Office for National Statistics – Labour Force Survey.For a more accessible version, please visit our accessibility policy.
Changes to Working Practices
Homeworking during coronavirus pandemic
The ONS has published analysis of Labour Market Survey data from April 2020 on homeworking patterns in the UK, broken down by sex, age, region and ethnicity.
In April 2020, nearly half (46.6%) of people in employment did some of their work from home, with the vast majority (86.0%) of these homeworkers stating that this was because of the coronavirus pandemic. Of those who did some work from home, around one-third worked fewer hours than usual (34.4%), and around one-third worked more hours than usual (30.3%).
There are regional variations for those doing some of their work at home. More than half of people living in London (57.2%) did some work at home, while just over one-third of workers living in the West Midlands (35.3%) and Yorkshire and The Humber (37.6%) did some of their work from home.
Wales, Scotland, and Northern Ireland saw broadly similar proportions of homeworkers (approximately 40%).
Of those residents of London who did some work at home, 91.6% cited the coronavirus pandemic as their main reason for doing so. Conversely, the North East (76.6%) and the South West (79.1%) were the two regions where respondents were least likely to cite the coronavirus pandemic as the main reason for homeworking.
Figure 9: Homeworking rates, by region, of those in employment (aged 16 years and over), UK, April 2020
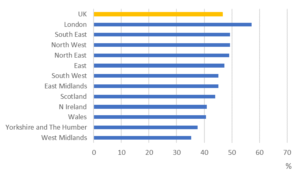
A homeworker refers to a person who did anything working from home in the reference week. Source: Office for National Statistics, Labour Market Survey. For a more accessible version, please visit our accessibility policy.
Occupations requiring higher qualifications and experience are more likely to provide homeworking opportunities than elementary and manual occupations. The first four major occupations all saw over half of their workers doing some amount of homeworking. Over two-thirds (69.6%) of the professional occupations did some work at home.
Conversely, the last five major occupations (except “Elementary Occupations” which has been excluded because of small sample sizes) all saw under 20% of their workers doing some amount of homeworking. The skilled trade occupations saw 18.9% of their workers home working
Those working in associate professional and technical occupations were most likely to cite the coronavirus pandemic as the main reason for homeworking (91.1%), while those in skilled trades occupations were least likely to do so (65.0%).
Figure 10: Homeworking rates, by occupation, of those in employment (aged 16 years and over), UK, April 2020
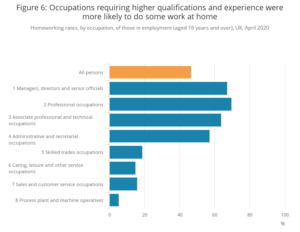
Source: Office for National Statistics, Labour Market Survey. For a more accessible version, please visit our accessibility policy.
Additional analysis published in July 2020 examined the ability to work from home by occupation, considering location, interaction intensity, exposure to hazards, physical activity and use of tools/equipment to develop a measure of the ability to work from home. This analysis was conducted using data from the Occupational Information Network (O*NET) database. One additional element – not fully reflected by the measure – is the access to technology and extent to which the workplace is digitalised.
The analysis showed that professional occupations such as actuaries, economists and statisticians are most likely to be able to be done from home. Occupations such as these, alongside management, technical and administrative jobs, involve relatively little face-to-face contact, physical activity or use of tools or equipment.
Applying data from the Annual Survey of Hours and Earnings showed employees who earn higher hourly wages are more likely to be able to work from home. Employees in the 20% of the workforce most likely to be able to work from home had median earnings of around £19.00 per hour, compared with around £11.00 per hour for workers in the 20% of the workforce in jobs least likely to be adaptable to home working.
The gender split of the 20% of the workforce most likely to be able to work from home is fairly representative of the workforce as a whole: 49% are women. Around 75% of employees in the 20% of the workforce least likely to be adaptable to work from home are men.
Skill level of Employees Working from Home
According to the Standard Occupational Classification (SOC) manual, occupations can be classified into four skill levels defined with respect to the duration of training and/or work experience normally required to perform the job competently and efficiently.
The first skill level equates with competence associated with a general education, usually acquired by the time a person completes compulsory education and signaled via a satisfactory set of school-leaving examination grades. Competent performance of jobs classified at this level will also involve knowledge of appropriate health and safety regulations and may require short periods of work-related training. Examples of occupations defined at this skill level within the SOC2010 include postal workers, and catering assistants.
The second skill level covers a large group of occupations, all of which require the knowledge provided via a good general education as for occupations at the first skill level, but which typically have a longer period of work-related training or work experience. Occupations classified at this level include machine operation and caring occupations.
The third skill level applies to occupations that normally require a body of knowledge associated with a period of post-compulsory education but not normally to degree level. A number of technical occupations fall into this category, as do a variety of trades occupations and proprietors of small businesses. In the latter case, educational qualifications at sub-degree level or a lengthy period of vocational training may not be a necessary prerequisite for competent performance of tasks, but a significant period of work experience is typical.
The fourth skill level relates to what are termed ‘professional’ occupations and high-level managerial positions in corporate enterprises or national/local government. Occupations at this level normally require a degree or equivalent period of relevant work experience
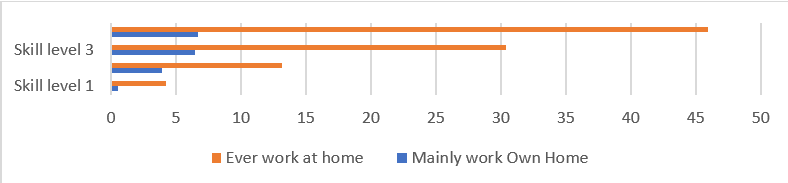
Using the published data for occupation groups on the level of homeworking, one can sum occupations into skill categories and calculate a rate of homeworking for each skill level.
In 2019, the highest skill level showed the highest proportion of individuals homeworking, with the lowest skill level showing the least. While these data do not reflect the COVID-19 period, they do provide an insight into the skill group previously most likely to homework.
Figure 11: Percentage of employed reporting to have worked from home by skill group in 2019

Skill levels taken from SOC 2010. Source: Office for National Statistics – Annual Population Survey. For a more accessible version, please visit our accessibility policy.
Homeworking by Industry
This section includes information from the Business Impact of Coronavirus Survey for the period 7 September to 20 September 2020.
Across all industries, of businesses not permanently stopped trading, 9% of the workforce were on partial or full furlough leave (compared with 30% in early June), 59% were working at their normal place of work and 28% were working remotely.
The arts, entertainment and recreation industry and the accommodation and food service activities industry had the highest proportions of their workforce on partial or full furlough leave under the terms of the UK government’s Coronavirus Job Retention Scheme (CJRS), at 32% and 27% respectively
The information and communication industry and the professional, scientific and technical activities industry had the highest proportions of their workforce working remotely instead of at their normal place of work, at 74% and 62% respectively.
Figure 12: Working arrangements, businesses who have not permanently stopped trading, broken down by industry, weighted, UK, 7 September to 20 September 2020
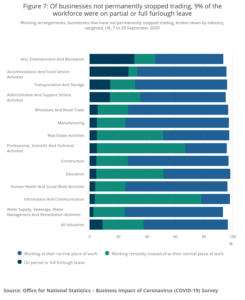
Source: Office for National Statistics – Business Impact of Coronavirus. For a more accessible version, please visit our accessibility policy.