Dear Lord Wood,
Thank you for inviting me to give evidence for the Committee’s inquiry on Preparing for an Ageing Society. During that session on 1 April, I promised to follow-up with the Committee on several topics, as our discussion ranged from population projections to fertility rates and migration. I have annexed further information on, specifically:
- Population projections, including information about the impact of retirement age on the dependency ratio, and accuracy of historic projections.
- Fertility, linked to impact of housing and other socio-economic factors.
- Migration, including impact of post-Brexit trends on age of the population and proportion of over 65s who are migrants.
- Labour market, linked to points about over 50s returning to workplace and productivity changes by age.
I hope this is helpful, and please do let me know if you or the Committee have any further questions that the Office for National Statistics (ONS) can help with.
Yours sincerely,
Mary Gregory
Director for Population Statistics, Office for National Statistics
Annex: Follow-up to evidence session of 1 April 2025
Population projections
The national population projections give an indication of the potential future population size of the UK and its constituent countries. These statistics are widely used in planning, including fiscal projections, health, education and pensions. National population projections are not forecasts and do not attempt to predict potential changes in international migration. Migration assumptions do not directly account for recent and future policy or economic changes. Demographic assumptions for future fertility, mortality and migration are based on observed demographic trends.
Retirement age impact on the dependency ratio
The ONS publish population projections of the future size and age structure of the population of the UK and its constituent countries. The 2022 based National population projections show an old age dependency ratio of 278 people above pension age to every 1,000 people aged 16 to pension age.
State pension age is planned to be raised from 66 to 67 between 2026 and 2028. Based on ONS population projections, to hold the current old age dependency ratio of 278 constant, pension age would need to rise to 68 in the first half of the 2030s, 69 in the second half of the 2030s, and 70 in the 2040s.
Accuracy of ONS population projections
The ONS has published methodology on comparing national population projections to mid-year population estimates from 1971 to 2022 with population estimates, births, long-term international migration, and deaths, including measures of error. This helps users understand the uncertainty inherent in population projections, where this has come from in our previous releases and for them to make judgements on the potential uncertainty in our latest projections. We have published similar reports on a decennial basis in the past following the reconciliation and rebasing of population estimates.
Figure 1 show that projections from 2006-based onwards generally follow the estimated population increase closely.
Figure 1: Total population estimates compared with projections by UK country, 1971-based to 2022-based projections
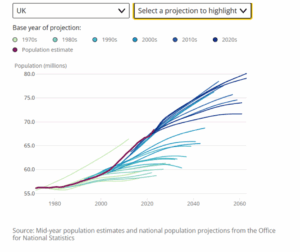
Source: mid-year population estimates and national population projections from the Office for National Statistics
We produce assumptions for future levels of migration by reviewing what has happened in the past and modelling plausible future scenarios. We consult with a panel of independent academic experts working in the field of demography to discuss the possible forces that may influence future demographic behaviour.
The migration assumptions are not a forecast or prediction of future migration levels; they should be interpreted as a potential scenario in which future net international migration averages at a certain level.
There has been substantial change in international migration over recent years. This has been reflected in the changing patterns of age and sex profiles of international immigration and emigration. The migration component within the National Population Projections system has become larger over recent projections, as the long-term assumption has increased.
We used a 10-year average of international migration (for the 10 years ending mid-2023) to set the principal long-term international migration assumption. Four variant projections have been produced to show what might happen to the UK population if international migration is higher, lower, if there is a faster decline in net migration based on the types of migration over recent years, and if there is no international or internal migration (from the base year); these are all compared with the principal assumption.
Migration assumptions are initially set at an aggregate level for inflows and outflows. Single year of age and sex distributions are then generated and are applied to the assumed aggregate totals, using data from the five years prior to the projections base.
Fertility rates
Impacts of education/employment/housing on fertility rates
Our latest publication on childbearing for women born in different years, England and Wales: 2023, was released on 2 April, and shows the changing composition of families over time, comparing the fertility of women of the same age and the number of children they have had. The focus is on the fertility patterns of women born in 1978 and compare them with past and projected future generations; this is the most recent cohort for which we have observed completed family size data. For the first time ever, we have published fertility rates using data from the 2022-based national population projections (NPPs) principal projection for England and Wales.
Women in England and Wales who were born in 1978 have an average completed family size of 1.95 children, which is the highest average since women born in 1961; however, this is a lower average when compared with 2.04 children for their mothers’ generation (assumed to be those born in 1951).
Women born in 2007 (now 18 and considered to be the daughters of those born in 1978) are projected to have smaller families than their mothers, with an average completed family size of 1.52 children; this estimate uses the 2022-based principal national population projections.
In October 2024, the ONS published an article looking at how the fertility rate is changing in England and Wales, which highlights that babies are increasingly being born to older mothers. One possible element contributing to this is the rise in participation in higher education, particularly for women. For example, higher education percentage in England by age 25 for females was 54.9% for 2022/23. Putting that in context of the time series, the latest cohort we can report participation by age 25 for is the 15-year-olds from 2012/13, and for this cohort CHEP-25 was 49.0%, an increase of 10.2 percentage points compared to the 2001/02 cohort.
In our article “Milestones: journeying through modern life”, we reference that women start full-time work later than men, with a potential reason being that more women participate in higher education than men. In the most recent figures, 80.2% of women aged 25-34 in the UK were employed (compared to 87.8% of men). Many milestones, such as moving out of the family home, getting married for the first time and buying a home, are happening later in life compared to 2011 or before.
As discussed at the session, the ONS has not completed work on how far these socio-economic factors, such as inability to buy or rent a property until later in life, impact the fertility rate. However, you may be interested to consider academic literature on the topic, such as the positive correlation between education and fertility intentions in Europe (2014) and the recent decline in period fertility in England and Wales(2022).
Migration
Migration trends and their impact on the age of the UK population since the UK left the EU
The ONS publish an analysis of population estimates tool for the UK, allowing users to examine the components of change and view the longer-term impact of different levels of migration on age distribution.
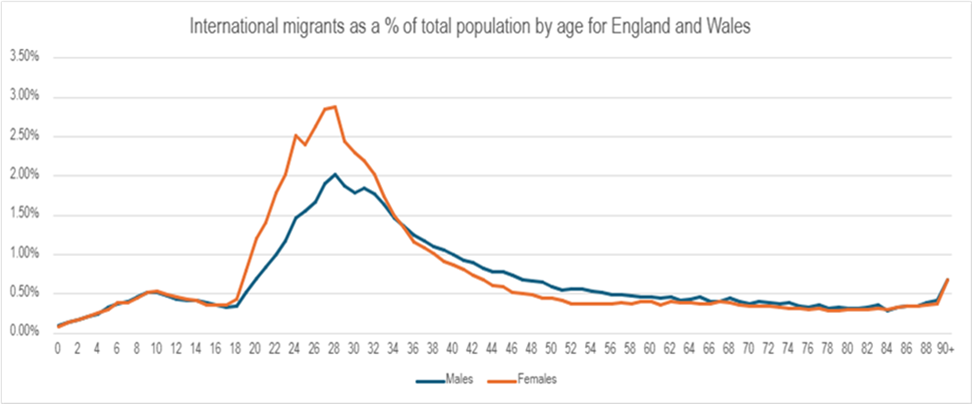
Reviewing the time period since the UK left the EU (implemented from 31 January 2020) (noting this period covers changes to migration during the pandemic), it shows that the higher levels of net international migration in the year to mid-2022 and mid-2023 appear to have stalled the rise in median age. In the long run, with net inward migration, all remaining migrants age. Figure 2 details the age distribution as a percentage of England and Wales population for net international migration for 2023.
Figure 2: International migrants as a % of total population, by age, for England and Wales
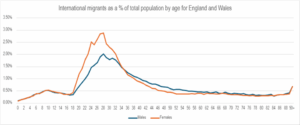
Source: Office for National Statistics
The proportion of older people who are migrants
The ONS has published estimates of the population of England and Wales by country of birth and passports held based on data from Census 2021. This data can be interrogated by age, sex and geography in the Census 2021 Custom Dataset Tool and in the Census 2021 Maps interactive data.
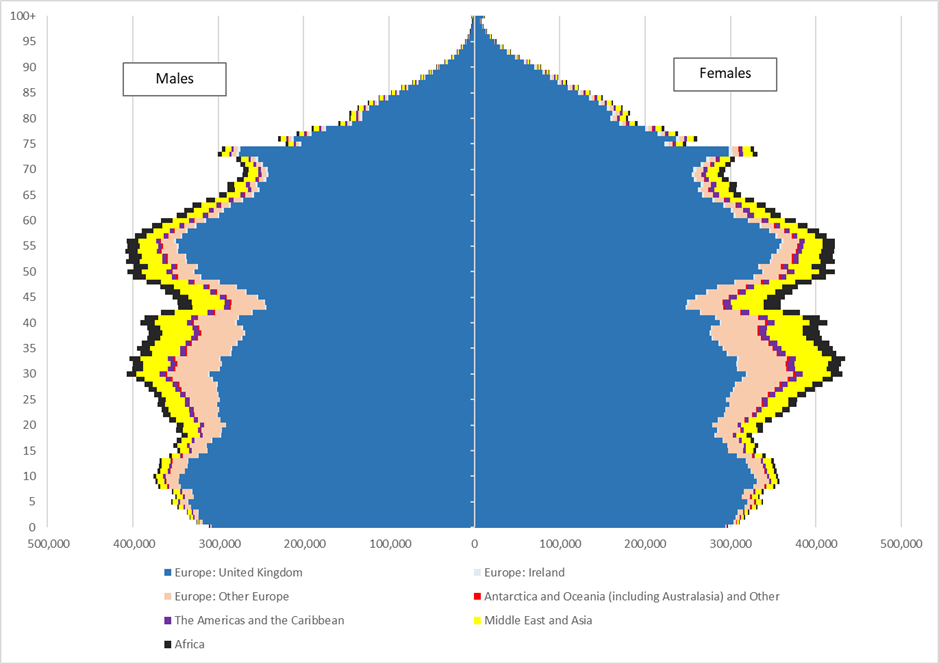
Figure 3 shows country of birth by age for England and Wales. It shows that the greatest numbers of non-UK born are in the working ages. In the peak working ages of 20-49, just over one in four people were born outside the UK. It is also worth noting the sizeable numbers approaching pension age. Many of the young children will be born to migrants. In 2023, 37.3% of live births were to parents where either one or both were born outside the UK, an increase from 35.8% in 2022.
Since Census 2021, there has been net migration of about 1.5m. Our latest estimate of the population of England and Wales was the year ending June 2023 and includes 11,439,000 non-UK-born people; of which EU-born was 3,395,000 and non-EU-born was 8,044,000.
Figure 3: Age distribution by country of birth and sex, England and Wales
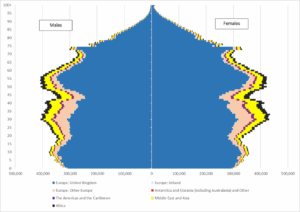
Source: Census 2021 custom table builder, ONS
Labour market
Over-50s in the labour market
The Department for Work and Pensions uses ONS data to publish statistics on the economic labour market status of individuals aged 50 and over by five-year age bands and gender. Their latest release was in September 2024, using April-June 2024 data.
In that release, they concluded that from 2019 to 2023, the employment rate of older adults decreased each year from a record high in 2019 of 72.5% to 70.7%. The inactivity rate in 2024 for those aged 50 to 64 continues to remain higher than the pre-pandemic rate, which was 25.5% in 2019. Moreover, the economic inactivity rate for women aged 50 to 64 remains statistically significantly higher, at 31.3% in 2024, when compared to men of the same age (23.2%).
Productivity changes as people get older
As discussed during the session, there is no clear evidence as to whether older workers are more productive. Age can be a proxy for work experience, where older workers might be more productive because of their greater experience. However, younger workers are typically considered more dynamic. This might lead to better matching between workers and jobs, which could improve productivity.
The ONS is in the early stages of developing a Linked Employer-Employee Dataset (LEED) that will allow researchers to improve our understanding of how workers move between firms throughout their lives, and the relationships between employee and firm-level outcomes such as wages and productivity. We will keep the Committee updated as this work progresses.
Office for National Statistics
May 2025