Gender representation
57.2% of our workforce are women, this is an increase from 56.6% in 2021.
42% of our Senior Civil Servants are women, this is an increase from 39.8% since 2021.
Whilst we still have more to do to achieve an equal gender balance at senior grades, we are pleased with our trajectory in making year-on-year improvements to the proportion of women in the workforce.
Figure 1 shows the breakdown of women and men across all grades for March 2022.
Figure 1: Breakdown of grade by gender in March 2022
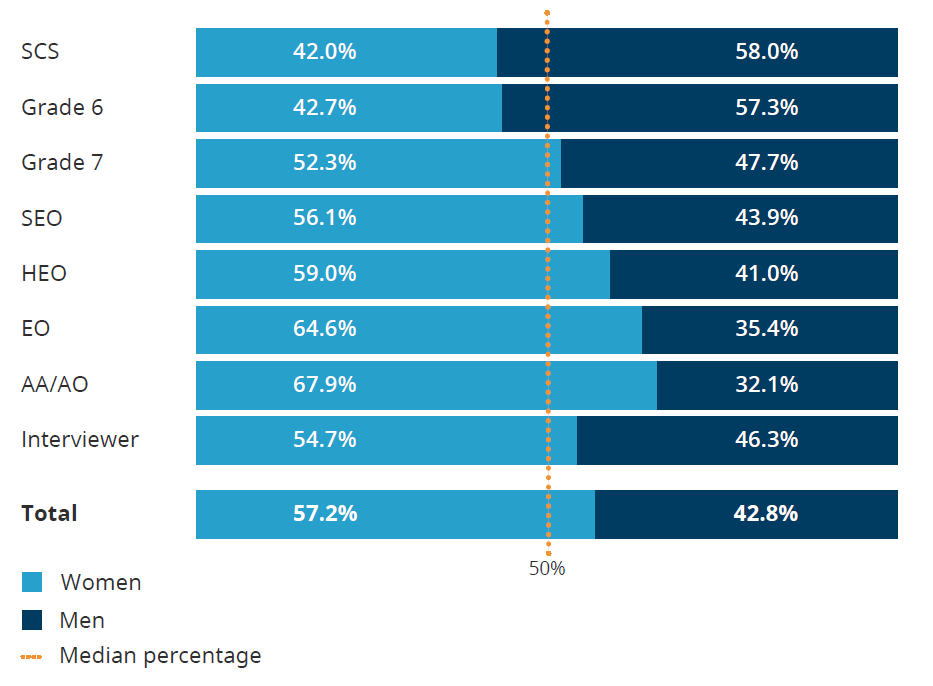
| Grade | Women | Men |
|---|---|---|
| SCS | 42.0% | 58.0% |
| Grade 6 | 42.7% | 57.3% |
| Grade 7 | 52.3% | 47.7% |
| SEO | 56.1% | 43.9% |
| HEO | 59.0% | 41.0% |
| EO | 64.4% | 35.4% |
| AA/AO | 67.9% | 32.1% |
| Interviewer | 54.7% | 46.3% |
| Total | 57.2% | 42.8% |