Gender pay gap report
Definitions
Gender pay gap
The gender pay gap is the difference in average pay between all men and women in an organisation. It is expressed as a difference in percentage (%) between men and women.
Equal pay
The gender pay gap is different to equal pay. Equal pay deals with the pay differences between men and women who carry out the same jobs, similar jobs or work of equal value. It is unlawful to pay people unequally because
they are a man or a woman.
Mean pay gap
The mean pay gap is the difference in the arithmetic average hourly pay for women compared to men, within an organisation.
Median pay gap
The median represents the middle point of a population. If you lined up all the women in an organisation and all the men in order of the hourly rate at which they are paid, the median pay gap is the difference between the hourly rate for the middle woman compared to that of the middle man. The median is generally considered to be the better indicator of ‘average’ earnings because the mean can be skewed by fewer individuals earning more in the upper ranges. The median therefore gives a better indication of typical pay than the mean.
Hourly gender pay gap
Our mean hourly pay gap is 7.1% in favour of men, a reduction from 7.7% in 2021.
Our median hourly pay gap is 0.9% in favour of men, a reduction from 2.0% in 2021.
Gender bonus gap
83.4% of women were awarded a bonus.
80.1% of men were awarded a bonus.
The mean bonus pay gap is 3.3% in favour of men, decreasing from 15.6% since 2021.
The median bonus pay gap is 0.0%, decreasing from 16.7% in favour of men since 2021.
Pay by quartile
Figure 2 shows hourly pay, by quartile for the Authority and shows there is a higher proportion of women (compared to men) in all quartiles except the upper pay quartile.
The upper pay quartile is mostly populated by higher paid grades, specifically the Senior Civil Service, Grade 6 and Grade 7. Actions have therefore been focused on increasing representation of women in these grades. We are delighted to have made such progress, and we will continue to prioritise this in the coming year.
Figure 2: Distribution through each pay quartile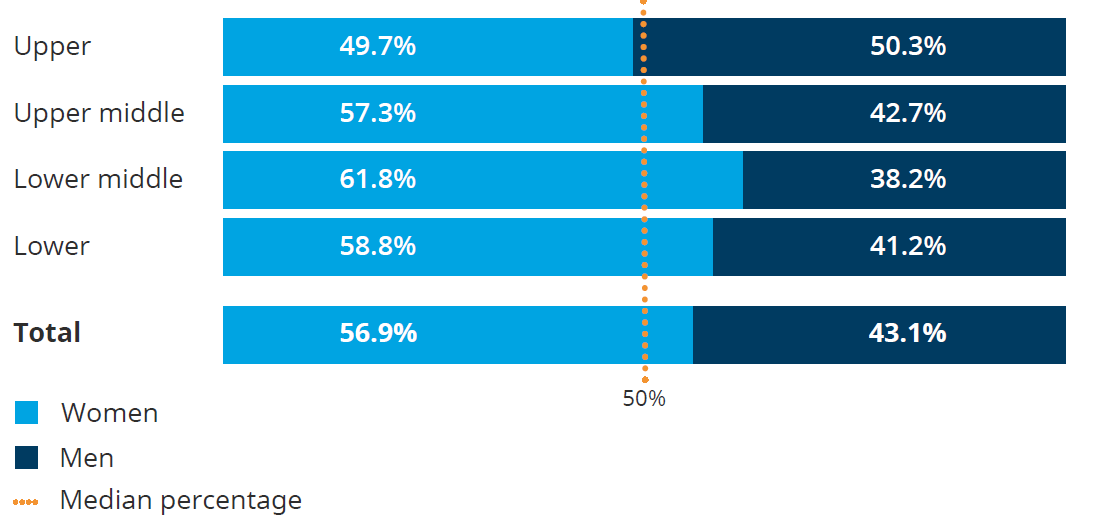
| Pay quartile | Women | Men |
|---|---|---|
| Upper | 49.7% | 50.3% |
| Upper middle | 57.3% | 42.7% |
| Lower middle | 61.8% | 38.2% |
| Lower | 58.8% | 41.2% |
| Total | 56.9% | 43.1% |