Confidentiality and disclosure risk
The issue: Disclosure by location
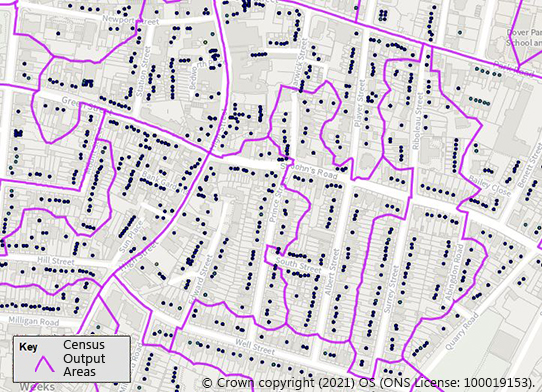
Geospatial data often has complex sources and in some circumstances can be disclosive (revealing personal information) – either in its own right or in combination with other sources. An individual (X, Y) location can point at a single address or business. A small area can pinpoint a small enough number of cases to be disclosive. Critically, a combination of overlapping areas can also pick out a sliver which provides enough information to identify small populations. Remember that for these purposes businesses are due similar rights of data protection as individual members of the population, so many of the same ethical considerations apply.
Some data types are particularly sensitive. The locations of refuges or safe houses, for example are, by definition, sensitive and the greatest care must be taken in ensuring we do nothing to put vulnerable populations at risk.
Statistics produced for small areas can be disclosive – because the number of individuals or businesses included is small enough to reveal information about individual items. Releasing figures for an area which contains only one dominant item – say a single large factory – can be much the same as releasing data about just that factory.
In general, you will want to choose a geography small enough to reveal useful differences but large enough to include a non-disclosive number of observations.
In most cases as the sample size gets smaller or item being presented gets more rare you need to make the geography larger to avoid disclosure.
The census, for example, is an estimate for the whole population so a relatively small geography – the output area (average size around 150 households) – can be used for most outputs.
 For rarer events or those where there are cross-tabulations, you could not release for this small a geography – the census uses LSOAs, MSOAs (see below) and even Local Authorities for rarer events.
You need to always think about your output geography and keep it under review as events change. As COVID-19 numbers declined in the spring of 2021, for example, the geography for which detailed case figures could be released was made larger by grouping together LAs.
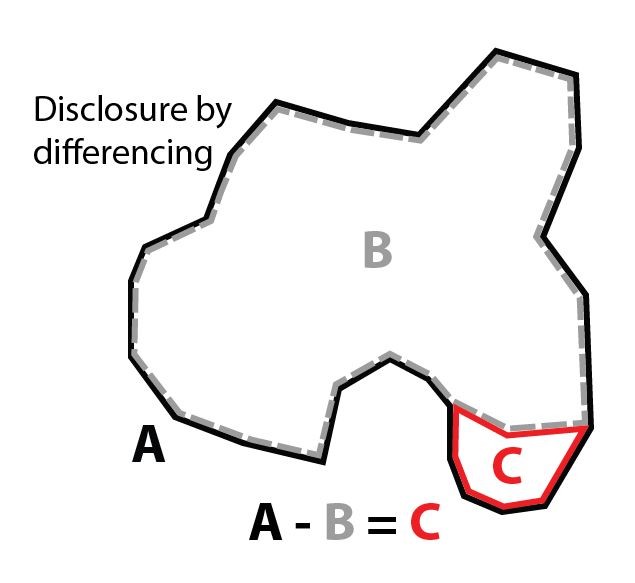 Outputs for overlapping geographies can cause problems. By producing outputs for overlapping areas A & B … we are inadvertently revealing something about area C.
This issue can often arise where boundaries change over time. Produce the same statistics for two versions of a changing geography and you may reveal information for the population that falls in the changed areas. This is much less of a problem when producing statistics over time because the uncertainty that arises as the result of changing populations reduces the disclosure risk.
In many cases disclosure by differencing is not a significant risk but in others a seemingly innocuous piece of disclosure – revealing the population or number of businesses in a small area – could unlock confidential information elsewhere. In all of this it is difficult to be definitive – it is impossible to be aware of all of the data available to users, but every attempt should be made to think through the implications of producing small area data.
Equally – remember good small area statistics bring real benefit in terms of improving services and outcomes, so potential risk should not necessarily be used as a rationale for avoiding local or small area data altogether.
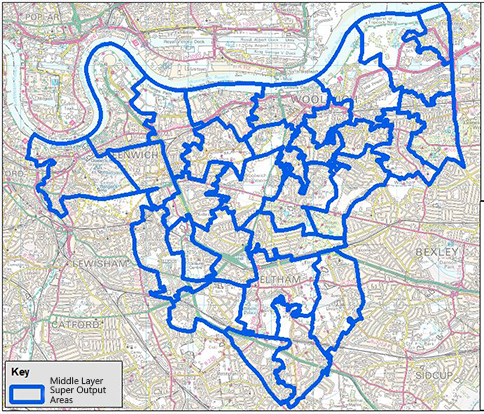 Census takes another important and potentially useful approach to mitigate the risk of disclosure – using a statistical geography specifically designed to be non-disclosive. ‘Lower Layer Super Output Areas’ (LSOAs) and ‘Middle Layer Super Output Areas’ (MSOAs) are a set of stable, nested geographies synthetically created such that every LSOA has a population of at least 1,000 people and every MSOA at least 5,000 people. A separate set of geographies built to avoid disclosure for business or workplace statistics is available – the Workplace Zones (WZs). Super Output Areas and Workplace Zones cover all of England and Wales while similar synthetic geographies are available for Scotland and Northern Ireland.
By being sure of the minimum population size of every SOA we can be more confident about which statistics can be released without disclosure risk. You can find out more about super output areas and workplace zones and how they can be used to reduce the risk of disclosure here.
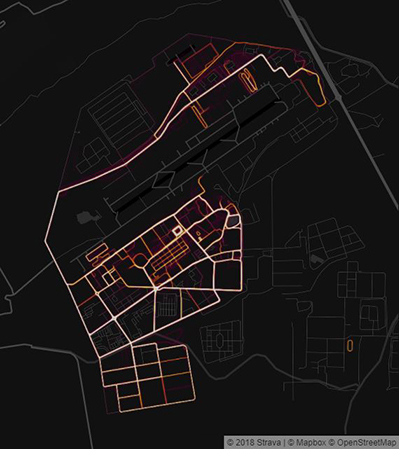 Routes and movements of individuals can be more disclosive than individual locations.
Consider, for example, a user whose phone location is consistently recorded at two separate locations through the week but at a different address at the weekends. There is more information here than a series of locations – and potentially more than the individual involved would have knowingly shared.
Data which co-locates individuals or transactions might allow us to make inferences, either true or false, about relationships – and in some cases location might have real implications for the personal safety of vulnerable people or groups.
As a result the use and potential sensitivity of location data is the topic of more frequent public discussion (for example, see public debates around the use of smartphone apps for the tracking of COVID-19 – and the resulting so-called ‘pingdemic’).
Nonetheless the fact that these technologies are now commonplace can also result in complacency. In 2018 the BBC reported an extraordinary example of this when multiple running routes of soldiers captured by GPS and reported on Strava, created ‘heat maps’ outlining sensitive military bases or routes.
Ethics and new technologies
Because the world is constantly changing, with new sources appearing all of the time, it can be hard to determine the potential sensitivity of geospatial data. In the future, currently unknown data sources, data types or technologies may be released into the public domain that allow an individual to be identified from an existing geospatial dataset. This means that current techniques may not be sufficient to truly anonymise data.
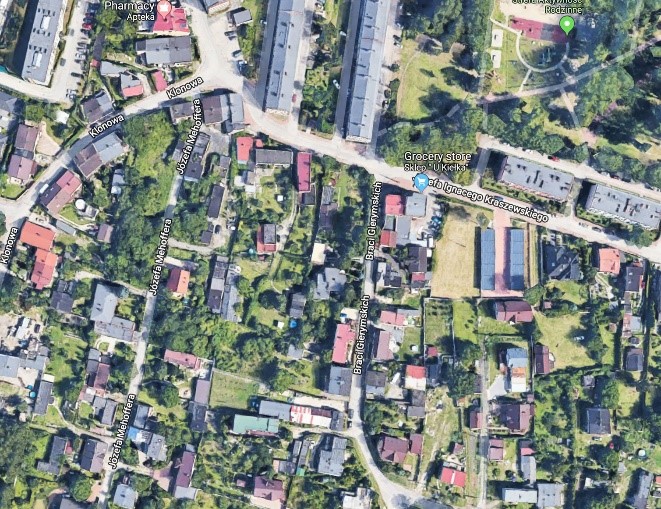
Google Earth and Street View are examples of such new technologies that have opened a huge potential benefit for understanding and analysis – but also a privacy debate. In the case of Street View the information provided can be viewed by anyone from the pavement (and so by definition is in the public domain). Equally Google have clearly taken steps to protect privacy (by automatically blurring some features).
Whilst these technologies are broadly welcomed and accepted by the public, as technology and the resolution of imagery improves there is a growing risk of disclosure of personal information. You should remain up to date on public views and opinion on these technologies and take care in publishing images.
 Equally, the very act of bringing this data together does open potential risks for disclosure in combination with other datasets – or the risk that users can unfairly judge or disadvantage an area from a distance – see later discussion of ‘red-lining’.
Note that the sensitivity of geospatial data will differ depending on the context, including, for example, the topic being analysed, the relative population density of an area, whether data relates to an urban or rural area and the extent of use of mobile phones in a particular location etc. In all of this it is difficult to be definitive.
Issues are not inherent in the sources themselves but rather in the way that they are used – as analysts we need to proceed with care and thought. Follow the checklist at the end of this guidance and you are less likely to go wrong.
Consent is a fundamental tenet for the ethical use of all types of personal data – and you should always consider whether consent has been given at an appropriate level for the use of any data that you are working with.
Because location is often obtained as a by-product of other processes, obtaining the chain of consent for the use of geospatial data may be difficult and data may pertain to individuals or organisations who have not (or not knowingly) granted consent. This might particularly be the case where data has been obtained by technology or telecoms companies. This is compounded by the potential for location data to be considered a private or intimate form of data.
Whilst it may be difficult as a researcher to fully understand the chain of consent this does not excuse you from all responsibility. It is important to consider and ask questions about the provenance of the data you are using and, as far as possible, to hold suppliers to account.
Advice and possible mitigations:
Now that we have considered the issue of confidentiality and disclosure risk, alongside some case examples, here are some of the ways in which these risks may be mitigated:
- Think hard about the geographies you are using for analysis and particularly outputs. Choose a non-disclosive geography for any outputs and perhaps consider using a statistical geography such as LSOAs or MSOAs – see the discussion above.
- You should collect and store the minimum amount of data required for your work. Data should be reviewed as soon as possible, and appropriate methods used to de-identify and protect the data. These methods might include limited release of transformed data, the use of synthetic data and randomised response approaches. The use of secure research access schemes might be further used to protect the data.
- Consider closely the provenance and potential limitations of any sources you are using. As far as possible, ask questions on how consent has been obtained for use of any personal data.
- The collection and use of geospatial data for research and statistics should be transparent, accountable and communicated clearly to the relevant communities. This is particularly important where data relates to vulnerable communities.
- Where consent can be collected for data use, procedures should ensure participant understanding of what is being collected when, why it is being collected, and what is being retained. To prevent misunderstanding and allay concerns, it may be equally important to emphasise what is not being collected.