Bias and discrimination
The issues:
Finding what you would expect
There is a danger that geospatial data, and how it is analysed, can reflect inherent biases about a location and, equally, can influence how the findings of a project are interpreted.
‘That’s what you would expect there’.
Geographic areas reflect wider socioeconomic conditions and inequalities, and existing biases and spatial inequalities can easily be mirrored back or exemplified. Take care in the assumptions you make about the areas you study and try to make sure that the way that you gather or use spatial data is not self-fulfilling. If you are carrying out a study to investigate a north / south divide, there is a real danger that you will spot this at the expense of other patterns, such as a rural / urban difference.
If you collect more data in the area where you expect an event to occur – you will get more events there, whatever the pattern. If you are looking for inner-city knife crime, you’ll find it, but potentially neglect problems in the suburbs. Often remote or extreme-rural communities can be disadvantaged by lack of data and lack of attention to their problems.
Always think about the spatial distribution of your sources – and as far as possible allow the data to reveal the story rather than looking just for evidence to confirm a particular theory. Analysts may be under pressure to find evidence to support a given policy – but need to lean on their professional experience or support to avoid being unfairly influenced.
Disadvantaging or ‘redlining’ areas
The use of geospatial data also has the potential to unfairly disadvantage or blight a geographic area or community. The extent to which this may present ethical issues will depend upon the particular question examined, the context and purpose of the project, and the nature of the data sources used.
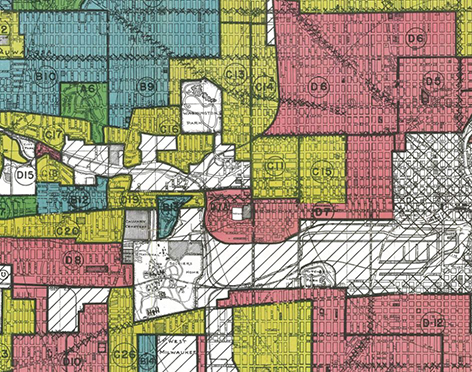 Where a location is identified by your analysis you need to give real consideration as to how the results or locations are released. There may be potential for physical safety implications at a group level if locations are released, particularly if this is linked to socially contentious topics or communities. In the worst case this might result in danger to individuals – but there is always the possibility of an area or community being disadvantaged or ‘redlined’. The term ‘redlining’ was coined by the sociologist John McKnight in the 1960s, to define the discriminatory practice of avoiding investment in communities with unfavourable or high-risk demographics, typically with large minority populations. Nonetheless, the risk of a community being disadvantaged by your analysis remains today.
Of course, the very purpose of geospatial analysis is to identify patterns and relationships. An analyst using geospatial data to spot that an area is subject to flooding, or has a higher crime rate, is producing results that are likely to have a (negative) influence on insurance costs for those affected. However, as long as such work is fairly conducted and reported, this analysis is not inherently unethical – negative impacts are balanced by positive ones elsewhere – but the way in which results are applied can of course be unethical. It is the analyst’s role to be honest, unbiased and to communicate any risks or weaknesses in the analysis clearly and openly.
Gender and sexuality bias
While in some ways we are past the days of the Victorian Census where the head of the household was almost always the man (Prince Albert was recorded as head of household – Queen Victoria as his wife), gender biases remain in many data sources. Caroline Criado-Perez’ recent book ‘Invisible Women’ describes the many hidden ways in which women may be excluded from data and so disadvantaged in the design of our world and in decision making. Obtaining equality and equal representation on both gender and sexuality in our sources is not primarily a spatial issue but we need to guard carefully against neglecting these in any data collection or collation processes. Where possible (and while ensuring we do no harm) we should be aware of gender and sexuality as dimensions in our data and be extra wary of bias here.
The ecological fallacy arises from erroneously assuming that relationships observed for groups necessarily hold for individuals.
This may result in:
- Misunderstanding relationships and correlations:
Death from heart disease is higher in countries with larger numbers of televisions, so … watching television must cause heart disease.
We all know that, while there may be relationships relating to sedentary lifestyle, the real factors leading to heart disease are much more complex than watching TV. However, when we know less about the topic, or if we want a relationship to be true, it is easy to slip into causal assumptions. Don’t.
- Drawing inferences about individuals from area data:
Surrey is the richest county in the UK, so everyone in Surrey has a big house.
This statement is clearly not accurate – but it is all too easy to fall into similar logical traps. Always remember that an accurate description of an area may not apply to many (or even any) of the people that live there.
 Area classifications (where areas are categorised in an attempt to capture the most common characteristics of their residents) is one topic where it is particularly easy to slip into assumptions. Individual residents of an area classified as ‘elderly town-dwellers’ may not be elderly, and they may not live in a town.
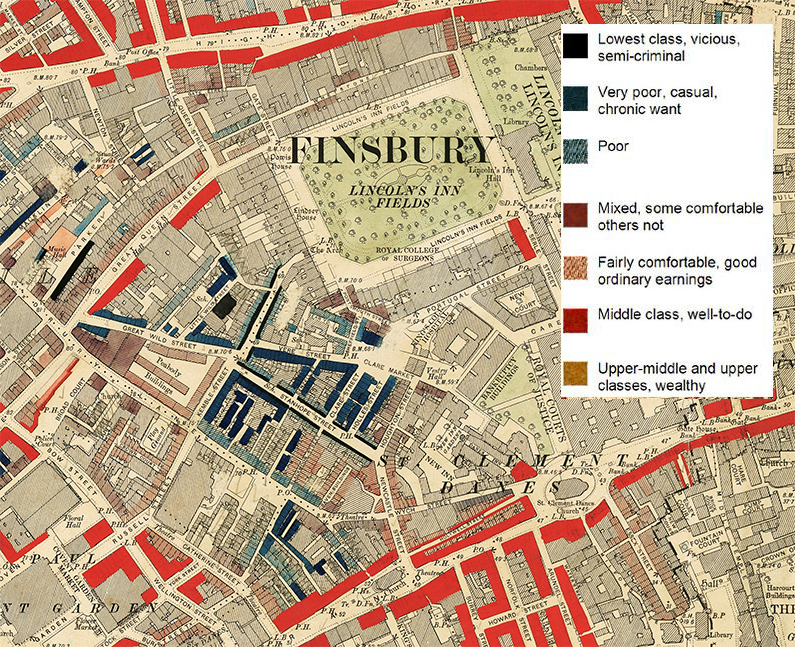
The ethical risk of classifications is clearest when you consider the maps of philanthropist Charles Booth which record household level poverty in London at the end of the 19th Century. While adopting language and terminology in use at the time, terms such as ‘lowest class, vicious, semi-criminal’ would not be employed today. Although we wouldn’t now publish disclosive maps like these, or choose a category name like that, as analysts we should still take care to avoid making our own versions of these mistakes.
Advice and possible mitigations:
- Think hard about your sources and any biases that they may contain. How might these influence the outcomes and what can you do to mitigate the bias? Are there additional data sources you can use to fill any gaps?
- Any potential for bias, and any potential impacts of this, should be clearly documented and communicated at all stages of the project.
- Think, too, about your assumptions about an area or topic and how they might influence your approach. As far as possible you should let the data tell the story – and check your assumptions.
- Where there is any potential for discrimination, the purpose for any data access and use should be clearly stated, with purpose limitation and reduced retention and re-use of data considered.
- The potential for disclosure of locations to result in a negative impact on groups or individuals should be considered. Depending on the context of the project, it may be more appropriate to use other forms of data presentation that do not disclose actual locations, for example – reporting themes rather than places and avoiding identifying areas using maps.
- The specific social context across different cultures or countries should be considered since discrimination or potential harms may be highly specific to a cultural or social context. Involving community members or colleagues with the expertise to understand the particular social or cultural context of a project should be considered.