Dear Mr Jones,
I write in response to the Business, Energy and Industrial Strategy Committee with an update of some key labour market statistics for the inquiry, ‘post-pandemic economic growth: UK labour markets”.
The Office for National Statistics (ONS) was asked to provide an update to the analysis supplied to the Committee in our written and oral evidence in July 2022. This letter provides an overview of the labour market in the UK, as well as a more focussed look at the impact of an ageing population, long-term sickness and long COVID. We have also included analysis of skills in the current labour market, which sectors are experiencing shortages in workers, and changes to working patterns.
I hope this evidence is useful to the Inquiry. Please let us know if there is anything further we can provide.
Yours sincerely,
Mike Keoghan
Office for National Statistics follow-up written evidence ‘post-pandemic economic growth: UK labour markets’, March 2023
Labour Market Overview
- The total number of jobs in September 2022 increased to a record 36.2 million. This is more than half a million jobs more than in December 2019 and the third consecutive period exceeding pre-coronavirus (COVID-19) pandemic levels.
- Employee jobs in September 2022 have continued to grow and are now at a record high of nearly 31.9 million, 1.1 million above December 2019. However, self-employed jobs, at 4.1 million, remain more than half a million below December 2019.
- The post-pandemic recovery varies by industry, with 8 of the 20 sectors still below their pre-coronavirus levels in September 2022. Job losses have been largest in wholesale and retail trade; repair of motor vehicles and motorcycles, and construction. This has been offset by large job gains in human health and social work; professional, scientific and technical activities; and information and communication.
- The unemployment rate had been increasing during the pandemic until the end of 2020 but has been falling throughout 2021 and started to increase until the end of 2022 but has now returned to pre-coronavirus levels.
- In October to December 2022, the unemployment rate increased to 3.7% and there were 1,270,000 people unemployed. In the latest three-month period, the number of people unemployed for up to six months increased, driven by people aged 16 to 24 years.
- Our latest estimates of the number of vacancies in the UK refer to the period November 2022 to January 2023. They show that there were 1.134 million vacancies, down 76,000 since August to October 2022. The overall number of vacancies has declined (by 166,000) from a record high of 1.3m in March to May 2022, however it remains 328,000 above its pre-pandemic level (January to March 2020).
- The fall in the number of vacancies since March to May 2022 has been primarily driven by falls in accommodation and food services (-27,000); information and communication (-24,000); and professional, scientific and technical activities (-22,000). There are however certain industries which have not reflected the broader picture of falling vacancies. In particular, public administration, education and health (industries with a significant public sector presence) all saw growth in vacancies sustained further into 2022. Despite tentative signs that vacancy numbers in these industries are starting to fall, they remain closer to their recent record highs when compared with other industries.
- High numbers of vacancies within the health industries are also evident when comparing against the pre-pandemic January to March 2020 period. In the latest period there were 70,000 more vacancies in health than there were before the pandemic. This was the largest growth across all industries, with the next largest growth, despite recent falls, seen in accommodation and food services (61,000) and professional, scientific and technical activities (42,000).
Economic Inactivity
Ageing population
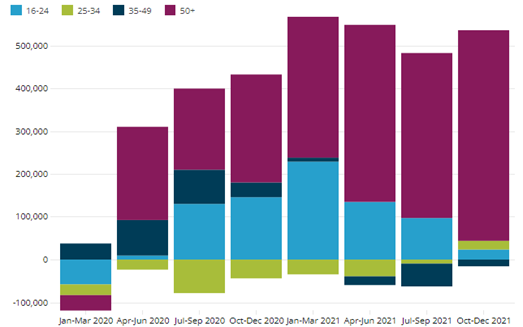
- The rate of economic inactivity has increased during the pandemic but has begun decreasing and is at 21.4% for October to December 2022. Overall economic inactivity has increased by 516,000 persons in October to December 2022 compared with before the pandemic (December 2019 to February 2020). The decrease of 113,000 in the last quarter has largely been driven by those aged 16 to 24 years. When looking at economic inactivity by reason, the quarterly decrease was driven by those inactive because they were students, retired or long-term sick.
- Over the pandemic period (since December 2019 to February 2020) economic inactivity has been driven by those aged 50 to 64 years, contributing 61% to the increase in economic inactivity. In October to December 2022 there were 3.5 million economically inactive people aged 50 to 64 years with a rate of 27.1% an increase of 318,000 since before the pandemic (December 2019 to February 2020)
- Analysis of people aged 50 to 65 who left or lost their job since the start of the coronavirus pandemic and would consider returning in the future found that those considering returning were on average younger: of those considering returning, 61% were aged 50 to 59; of those not considering returning, 33% were aged 50 to 59.
- Nearly a quarter (24%) of adults reported they had retired from their previous job, although only 6% of those aged 50 to 54 years reported this; stress (21%) was the most common reason for this younger age group. Those who felt they had the skills needed to get a new job were more likely to report retiring or not wanting to work anymore; those who did not were more likely to select a health reason for leaving paid work.
- In the publication ‘Worker movements and economic inactivity’ in the UK a logistic regression model was developed to understand factors that have predicted whether an individual is inactive or not in recent years. Analysis found that age is a strong predictor of inactivity; people aged 50 years and over are more likely to be inactive, but the coronavirus pandemic has made it more likely that those aged 65 years and over will be inactive.
Long-term sickness and long COVID
- Those people who have indicated poor or very poor health continue to be associated with an increased likelihood of being inactive compared with younger people and people indicating good or very good quality of health.
- The findings relating to poor health aligns with other recent publications on economic inactivity; which found between June and August 2022, around 2.5 million people reported long-term sickness as the main reason for economic inactivity, up from around 2 million in 2019. Between April to June 2019 and April to June 2022, the number of people aged 50 to 64 years who were economically inactive because of long-term sickness rose by 183,000 to 1.3 million (55% of inactive working-age adults because of long-term sickness).
- At the industry level, wholesale and retail workers are the ones most likely to become economically inactive because of long-term sickness. Other industries with high proportions of inactive workers because of long-term sickness are transport and storage, hospitality, health and social work, construction, and manufacturing. Most of these industries have low adaptability when it comes to hybrid working which may mean they are harder to carry out while managing a long-term sickness.
- The ONS published estimates relating to long COVID and employment. The analysis shows that between July 2021 and July 2022, the inactivity rate among working-age people with self-reported long COVID grew by 3.8 percentage points, compared with 0.4 percentage points among working-age people without self-reported long COVID. Of the 8.9 million working-age people who were economically inactive in July 2022, 375,000 (4.2%) had self-reported long COVID.
- Statistical modelling shows that among working-age people, the odds of inactivity (excluding retirement) for those reporting long COVID 30 to 39 weeks or 40 to 51 weeks after a first test-confirmed COVID-19 infection were 45.5% and 34.3% higher, respectively, compared with before the infection. The association between self-reported long COVID and inactivity (excluding retirement) was strongest for people aged 50 to 64 years. However, there was no evidence of differences in rates of post-infection transition to retirement between working-age people with and without self-reported Long COVID.
Skills
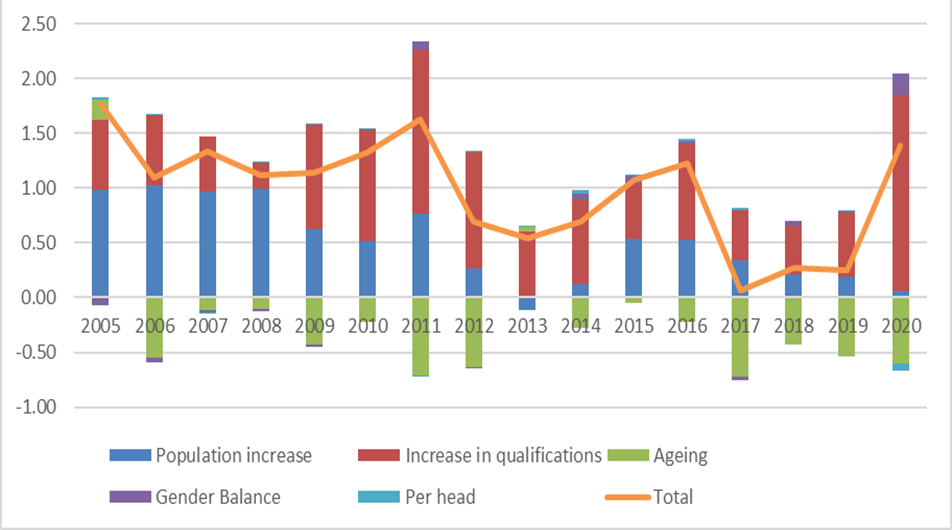
- Through our overview of human capital estimates in the UK, we can see there has been a steady rise in people with higher qualifications since 2004. In 2020, the number of working age people with a master’s or PhD qualification grew by 10.9% to 5.1 million when compared with 2019. Similarly, the number of people whose highest qualification was an undergraduate degree or equivalent grew by 7.5% to 9.4 million over the same period. These amounted to 22% of the working age population (16 – 65 years old) having at least an undergraduate degree or equivalent qualification in 2020. We aim to update estimates up to 2022 and publish regional estimates of these by the end of 2023.
- Looking at the skill levels distribution across the UK up to 2019 just before the pandemic, the ten most highly skilled-workforce local authorities were all concentrated in London, except for Cambridge and Rushcliffe. In these ten local authorities, between 47% and 54% of the employed population were in a ‘high-skill level’ job, such as a corporate manager or director, or in professional occupations like healthcare or science and technology. Local Authorities with the least highly skilled employed population in 2019 included Sandwell, Redcar and Cleveland, and Barking and Dagenham. Five of the ten local authorities with the lowest proportion of highly skilled employed individuals were in Yorkshire.
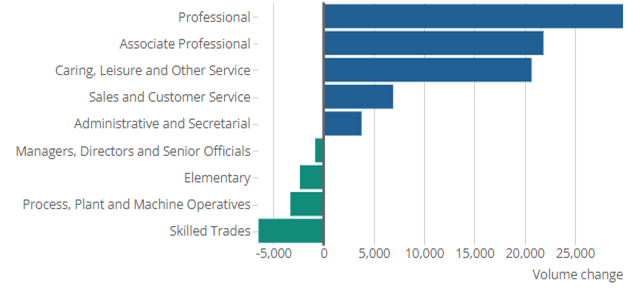
- To identify whether workers have the right skills, we look at labour demand indicators. In our most recent release, Labour demand volumes by profession and local authority UK, we identified changing demands that varied by local authority and other geographies across the UK. Demand for jobs was highest in healthcare professions like Care Assistant, Nurses, and Specialised Nursing, by December 2022, part of a long-term increase in demand in these types of jobs. Demand for all job adverts declined across 2022, and sales and trading professions declined the most, with their share of total adverts declining from 8.6% to 7.3%. The North East was most affected, with the decline largest in Stockton-on-Tees, decreasing by 75.6% in the year to December 2022.
- Across regions and countries of the UK, adverts in Wales and Northern Ireland declined faster than the UK average. The summary profession categories with the largest decline of advert share for both Northern Ireland and Wales were sales and trading and procurement and warehouse management. Within procurement and warehouse management adverts, warehouse staff and box fillers saw the largest declines in both Wales and Northern Ireland in that period. Focusing on Local Authorities, excluding local authorities in London, the six local authorities with the largest share of online job adverts in December 2022 were all large cities (Manchester, Birmingham, City of Bristol, Leeds, Glasgow City, Liverpool). These local authorities also had the largest increase in their share of UK adverts between December 2021 and December 2022. Apart from Liverpool, the other five had information and communication technology jobs as their highest demanded category.
- We have also previously looked at analysis of trends in demand across Local Authorities For example, online job advert trends in Scotland varied across local authorities, with urban areas typically seeing larger falls between January 2020 and January 2021, then growing more strongly between January 2021 and January 2022. Future work that the ONS intends to put out, including publishing occupational and skills demand measures later in the year.
- In addition to identifying skills shortages, the ONS is investigating the possibility to measure people’s skills and knowledge (their human capital) more directly to see what drives their development and how different groups of people develop different skills, as well as what other aspects influence this, like their health, family situation, and their wider environment. This work to develop and collect such a survey is being funded through a successful Economic Data Innovation Fund from HM Treasury.
Sectoral worker shortages
- Estimates from the Business Insights and Conditions Survey (BICS) suggest that , 12% of businesses in early January 2023 reported that they were experiencing a shortage of workers (unchanged from late December 2022). This was the lowest percentage since records began in October 2021 and has been falling since its peak in August 2022 (17%). Larger businesses (with 250 or more employees) were more likely to report worker shortages in early January 2023 (32%) compared with smaller businesses, though, the percentage reporting worker shortages has also fallen and is also at its lowest since records began.
- In early January 2023, the accommodation and food service activities industry continued to report the largest percentage of businesses experiencing worker shortages, at 25%, followed by the manufacturing industry at 18%, and human health and social work activities at 15%. These industries were also among the five that reported the highest proportion of worker shortages in the same period one year ago, although, the percentage that reported shortages in human health and social work activities and construction were larger in January 2022.
- Worker shortages are impacting businesses in different ways. In early January 2023, 5% of all businesses reporting worker shortages said that they were “unable to meet demands”, while 35% reported that “employees worked increased hours”. For businesses with 250 or more employees experiencing worker shortages, 63% said “employees worked increased hours” and 43% were “unable to meet demands”.
- Analysis of single-site businesses of single-site businesses shows that the proportion of businesses reporting a fall in worker shortages was highest in Wales (16%) in early January 2023, compared with Northern Ireland (12%), Scotland (12%) and England (11%). Compared with the peak of worker shortages in August 2022 (17%), the proportion of single-site businesses reporting a fall in worker shortages fell across all countries but fell least in Wales.
- Between March 2022 and December 2022, approximately 1 in 8 businesses reported having experienced difficulties in recruiting employees: rising to approximately 3 in 8 among larger firms (with 50 or more employees) over the same period. Accommodation and food service activities (29%), manufacturing (17%) and real estate activities (16%) had the highest percentage of businesses reporting difficulties in recruiting employees in December 2022.
- In December 2022, the most common reasons given for experiencing difficulties in recruiting employees were lack of qualified applicants for the roles on offer (54%), low number of applications for the roles on offer (47%) and almost a third said the business could not afford an attractive pay package to applicants. Across businesses reporting difficulties in recruiting, 48% reported they had difficulty recruiting skilled, manual or technical employees, followed by 43% that reported difficulties in recruiting semi-skilled or unskilled employees.
Working Patterns
- While the ONS does not publish any statistics on permanent full-time employment contracts directly, we do publish estimates of temporary employees and full-time/part-time employees in dataset EMP01, with further information about temporary employees in dataset EMP07. The following paragraphs are based on the estimates published in those two datasets.
- The proportion of temporary employees started increasing in mid-2020 and has remained around 6% since mid-2021. This is historically high but lower than in the 1990s and slightly lower than in the years following the 2008/09 global financial crisis. In October to December 2022, 5.8% of all employees were temporary employees.
- Prior to the COVID-19 pandemic, the number of temporary employees had been largely decreasing since late 2014. The number then began to increase in late 2019. Initially, as the pandemic took hold, the number decreased before rapidly increasing from the second half of 2020. In October to December 2021, the number of temporary employees reached its highest level since late 2014. The number of temporary workers has decreased slightly since then, but as of October to December 2022, it remains at historically high levels, although below the record highs seen in 1997.
- The increase in temporary employees during the COVID-19 pandemic, from July to September 2020, was largely driven by women. Initially, the increase was driven by employees who were in temporary work because they could not find a permanent job. However, the number of people in this group has been largely decreasing since April to June 2021. It has been those in temporary work because they did not want a permanent job who have largely driven the increase since early 2021, suggesting there is an increasing number of people in temporary work who are in their desired form of employment.
- In the Labour Force Survey (LFS), temporary employees include those on fixed period contracts, agency temps and those in casual or seasonal work. Those on fixed period contracts comprise the largest proportion of temporary employees – 42% in October to December 2022 – and it was this group that largely drove the increase in temporary workers during the COVID-19 pandemic.
- The number of full-time employees continued its upward trend during the pandemic and remains at historically high levels in October to December 2022. The number of part time employees fell sharply early in the COVID-19 pandemic but increased toward the end of 2021 and start of 2022. It has remained fairly stable since then and is well below pre-pandemic levels.
- Self-employment is at historically low levels. It had been growing consistently for two decades before the COVID-19 pandemic but fell sharply in the early stages of the pandemic and has not recovered yet. This fall was largely driven by people flowing from self-employed to employee status, and by people reclassifying their self-reported labour market status, while remaining in the same job.
Flexible working
- Prior to the COVID-19 pandemic, the proportion of people working from home had been steadily increasing. The Annual Population Survey found that between 2019 and 2020, the proportion of people who did any work at home (in the week prior to the interview) increased from 12.4%% to 25.9%. According to recent analysis on homeworking using the Opinion and Lifestyle survey (OPN), throughout 2022 the percentage of working adults reporting having worked from home has varied between 25% and 40%, without a clear upward or downward trend. Overall, 44% of workers reported home or hybrid working and 56% reported only travelling to work in the last seven days (September 2022 to January 2023).
- The proportion of workers both working at home and travelling to work (“hybrid working”) continues being much higher than pre-pandemic. According to the most recent data from the ONS Public Opinion and Social Trends Survey, in the period 25 January to 5 February 2023, 27% of workers reported both working from home and travelling to work (hybrid working).
- Those with higher incomes were more likely to work from home. Between September 2022 and January 2023, the highest levels of home only or hybrid working were seen in workers in the highest income band of £50,000 or more annual earnings – with 8 out of 10 workers in this category reporting home or hybrid working. This contrasts with workers in the lowest income band of up to £10,000 annual earnings where only 14% of workers reported home or hybrid working. Those in professional occupations reported the highest levels of home and hybrid working, and those in elementary occupations reported the lowest. Almost 1 in 4 workers with a degree reported working from home only, and 44% reported hybrid working.
- More than one in five businesses reported using or intending to include homeworking as a permanent business model, according to recent survey data from late January 2023. This is higher than the 16% reported in Autumn 2020.
- The use or willingness to include homeworking as a permanent business model differed by industry: the highest industry was the information and communication industry (62%), while it was lowest in accommodation and food services (2%) and transportation and storage (8%), both less adaptable to homeworking.
- Among business who reported using or intending to use homeworking as part of a permanent business model, the most common reason for doing so was reduced overheads (52%), improved staff well-being (48%) and increased productivity (43%).
- In terms of demand, analysis up to May 2021 highlighted how since lockdown, adverts mentioning homeworking had risen faster than total adverts. This also different substantially across the economy. 20.1% of IT, computing and software category adverts mentioned homeworking by May 2021, a slight decrease after Spring 2021 restrictions eased, while the share of adverts for creative, design and arts & media category jobs mentioning homeworking continued to increase even as the restrictions eased.